Technical Analysis of DOYU 2024-05-03
Overview:
In analyzing the technical indicators for DOYU over the last 5 days, we will delve into the trend, momentum, volatility, and volume indicators to provide a comprehensive outlook on the possible stock price movement. By examining these key factors, we aim to offer valuable insights and predictions for the upcoming days.
Trend Analysis:
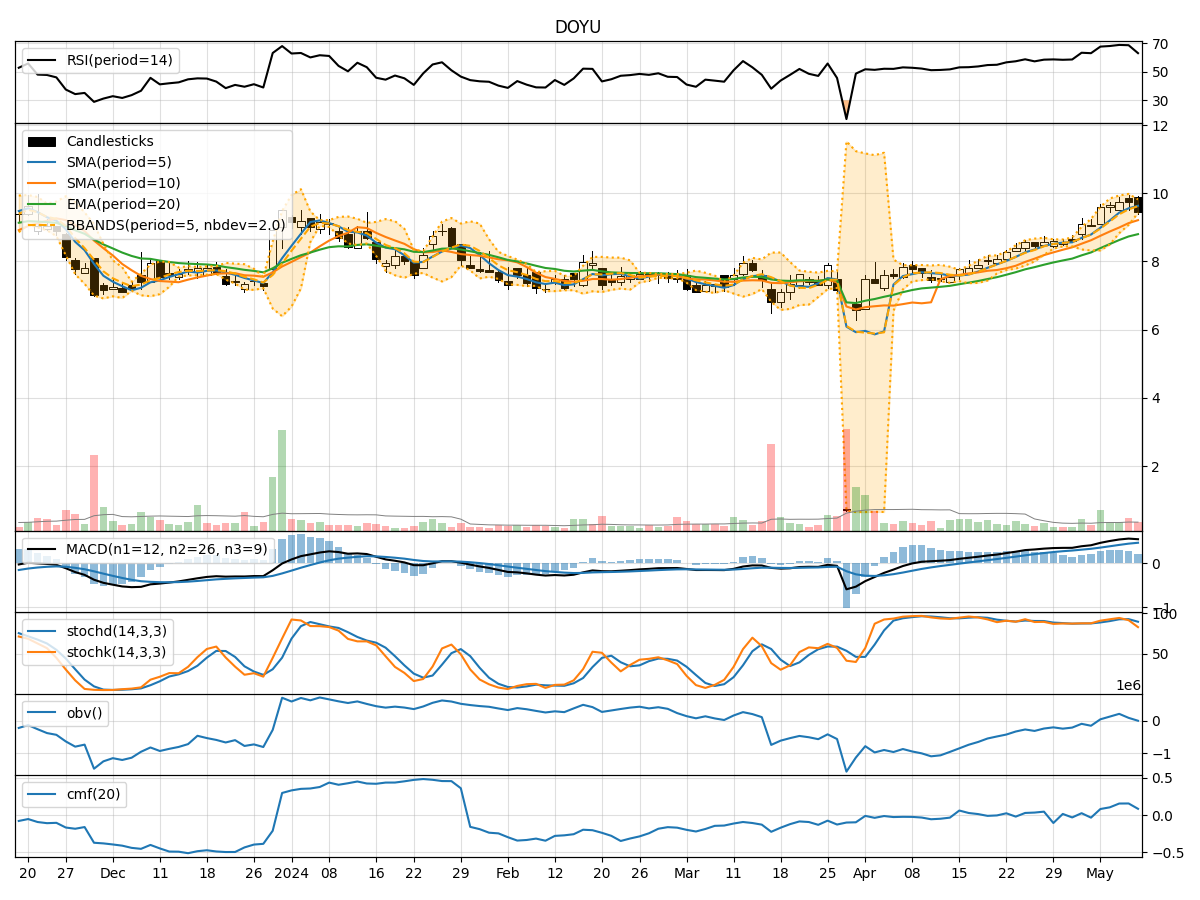
- Moving Averages (MA): The 5-day Moving Average (MA) has been steadily increasing, indicating a positive trend in the stock price.
- MACD: The Moving Average Convergence Divergence (MACD) has shown consistent growth, with the MACD line staying above the signal line, suggesting bullish momentum.
Momentum Analysis:
- RSI: The Relative Strength Index (RSI) has been in the neutral to slightly overbought territory, indicating potential strength in the stock.
- Stochastic Oscillator: Both %K and %D have been in the overbought zone, suggesting a strong upward momentum.
Volatility Analysis:
- Bollinger Bands (BB): The Bollinger Bands have widened, indicating increased volatility in the stock price.
Volume Analysis:
- On-Balance Volume (OBV): The OBV has shown mixed signals, with some days seeing negative volume divergence.
- Chaikin Money Flow (CMF): The CMF has been fluctuating around the zero line, indicating indecision in the market.
Key Observations:
- The trend indicators suggest a bullish sentiment, supported by the positive MACD and increasing moving averages.
- Momentum indicators point towards a strong upward momentum, as indicated by the RSI and Stochastic Oscillator.
- Volatility has increased, as shown by the widening Bollinger Bands, which could lead to larger price swings.
- Volume indicators show mixed signals, with some divergence in OBV and indecision in CMF.
Conclusion:
Based on the analysis of the technical indicators, the next few days for DOYU are likely to see continued upward movement in the stock price. The bullish trend supported by the positive MACD, strong momentum indicated by RSI and Stochastic Oscillator, and increased volatility could lead to further price appreciation. However, investors should closely monitor volume indicators for any signs of divergence or reversal in the trend. Overall, the outlook for DOYU appears bullish in the short term.