Technical Analysis of DPCS 2024-05-31
Overview:
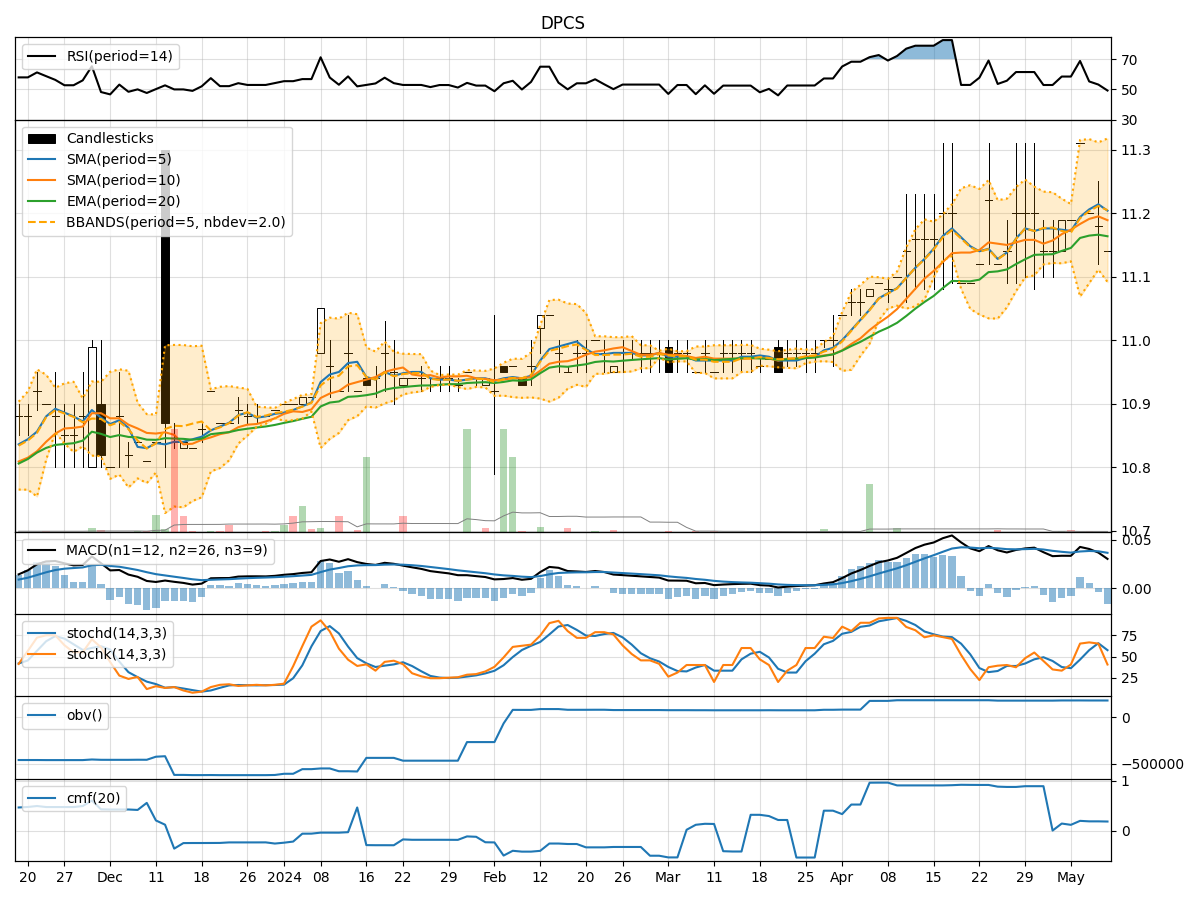
In analyzing the technical indicators for DPCS stock over the last 5 days, we will delve into the trend, momentum, volatility, and volume indicators to provide a comprehensive outlook on the possible stock price movement in the coming days. By examining these key indicators, we aim to offer valuable insights and predictions for potential investors.
Trend Analysis:
- Moving Averages (MA): The 5-day moving average has been relatively stable around the closing price, indicating a lack of significant trend direction.
- MACD: The MACD line has been consistently positive, suggesting a bullish momentum in the short term.
- EMA: The exponential moving average has shown a slight upward trend, indicating a potential bullish sentiment.
Momentum Analysis:
- RSI: The Relative Strength Index has been fluctuating around the neutral zone, indicating a lack of strong momentum.
- Stochastic Oscillator: Both %K and %D have been in the overbought territory, suggesting a potential reversal or consolidation.
- Williams %R: The indicator has been hovering around oversold levels, signaling a possible buying opportunity.
Volatility Analysis:
- Bollinger Bands: The bands have been relatively narrow, indicating low volatility in the stock price.
- Bollinger %B: The %B indicator has been close to 1, suggesting that the stock price is trading near the upper band.
Volume Analysis:
- On-Balance Volume (OBV): The OBV has shown a slight increase, indicating some buying pressure in the stock.
- Chaikin Money Flow (CMF): The CMF has been positive, reflecting a bullish money flow into the stock.
Key Observations:
- The trend indicators suggest a potential bullish sentiment in the short term.
- Momentum indicators show mixed signals, with RSI indicating neutrality and Stochastic Oscillator hinting at a possible reversal.
- Volatility remains low, indicating a lack of significant price fluctuations.
- Volume indicators point towards some buying interest in the stock.
Conclusion:
Based on the analysis of the technical indicators, the next few days for DPCS stock could see upward movement with a potential bullish bias. Investors may consider monitoring the momentum indicators closely for any signs of a reversal, while keeping an eye on volume and volatility for confirmation of the bullish trend. It is advisable to set appropriate stop-loss levels and closely monitor the price action for any changes in market dynamics.