Technical Analysis of EVLV 2024-05-10
Overview:
In analyzing the technical indicators for EVLV over the last 5 days, we will delve into the trend, momentum, volatility, and volume indicators to provide a comprehensive outlook on the possible stock price movement. By examining these key aspects, we aim to offer valuable insights and predictions for the upcoming days.
Trend Analysis:
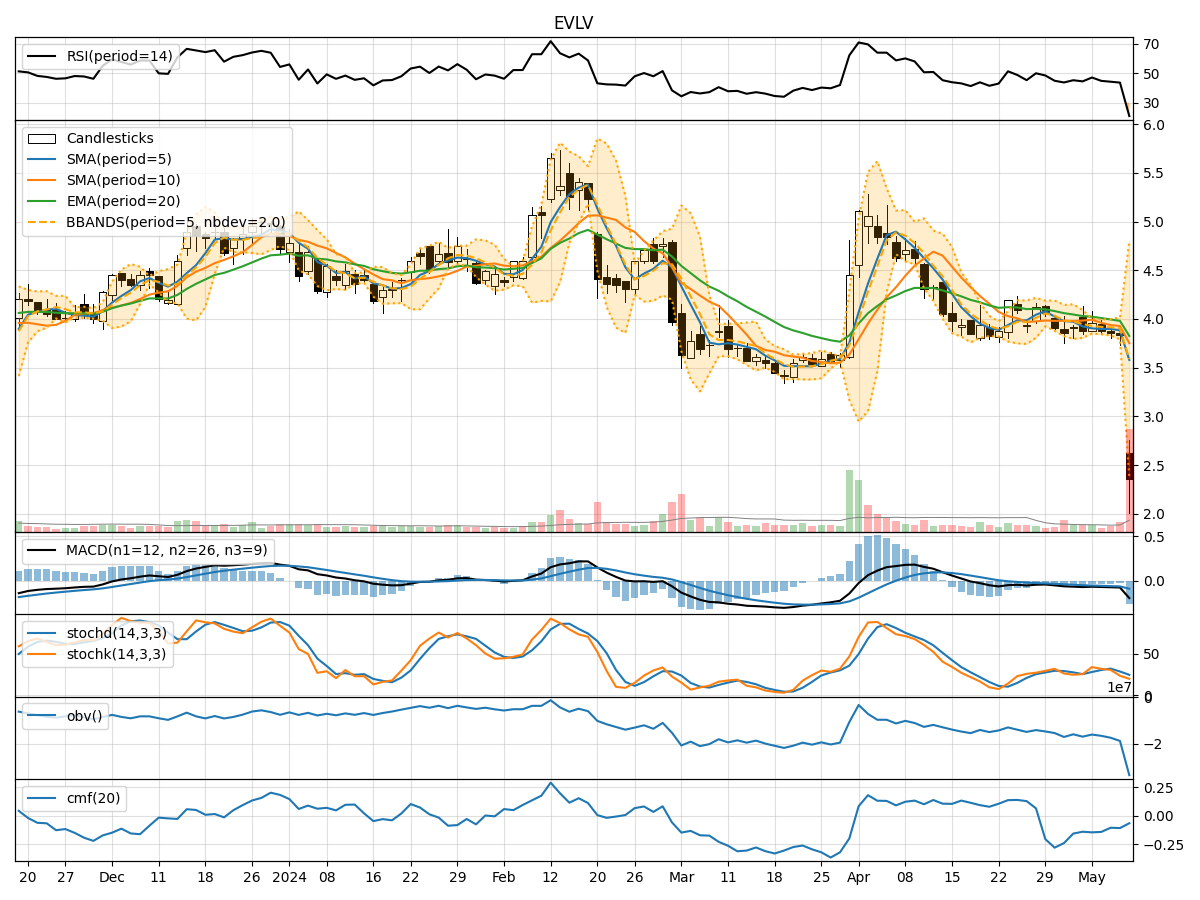
- Moving Averages (MA): The 5-day MA has been consistently decreasing, indicating a downward trend in the stock price.
- MACD: The MACD line has been negative, suggesting bearish momentum in the stock.
- EMA: The EMA has also been declining, reinforcing the bearish sentiment in the short to medium term.
Momentum Analysis:
- RSI: The RSI has been decreasing, reflecting weakening momentum and potential oversold conditions.
- Stochastic Oscillator: Both %K and %D have been trending downwards, indicating a bearish momentum.
- Williams %R: The indicator has been in the oversold territory, signaling a potential reversal or continuation of the downtrend.
Volatility Analysis:
- Bollinger Bands (BB): The bands have widened significantly, indicating increased volatility in the stock price.
- BB %B: The %B value is close to 0, suggesting that the stock is trading near the lower band, potentially oversold.
Volume Analysis:
- On-Balance Volume (OBV): The OBV has been consistently negative, indicating selling pressure and a bearish sentiment.
- Chaikin Money Flow (CMF): The CMF has been decreasing, reflecting a decrease in buying pressure and potential outflow of money from the stock.
Key Observations:
- The stock is currently in a downtrend based on moving averages and MACD.
- Momentum indicators such as RSI and Stochastic Oscillator suggest oversold conditions.
- Volatility has increased significantly, indicating heightened market uncertainty.
- Volume indicators point towards sustained selling pressure and a lack of buying interest.
Conclusion:
Based on the analysis of the technical indicators, the next few days for EVLV are likely to see further downward movement in the stock price. The bearish trend, coupled with oversold conditions and negative momentum, suggests that investors should exercise caution. Consolidation or a potential reversal may occur if there is a significant shift in market sentiment or a positive catalyst. However, the current outlook leans towards a continuation of the bearish trend. Investors should closely monitor key support levels and wait for signs of a trend reversal before considering any bullish positions.