Technical Analysis of EXPE 2024-05-10
Overview:
In analyzing the technical indicators for Expedia Group Inc. (EXPE) over the last 5 days, we will delve into the trends, momentum, volatility, and volume indicators to provide a comprehensive outlook on the possible stock price movement. By examining these key aspects, we aim to offer valuable insights and predictions for the upcoming days.
Trend Analysis:
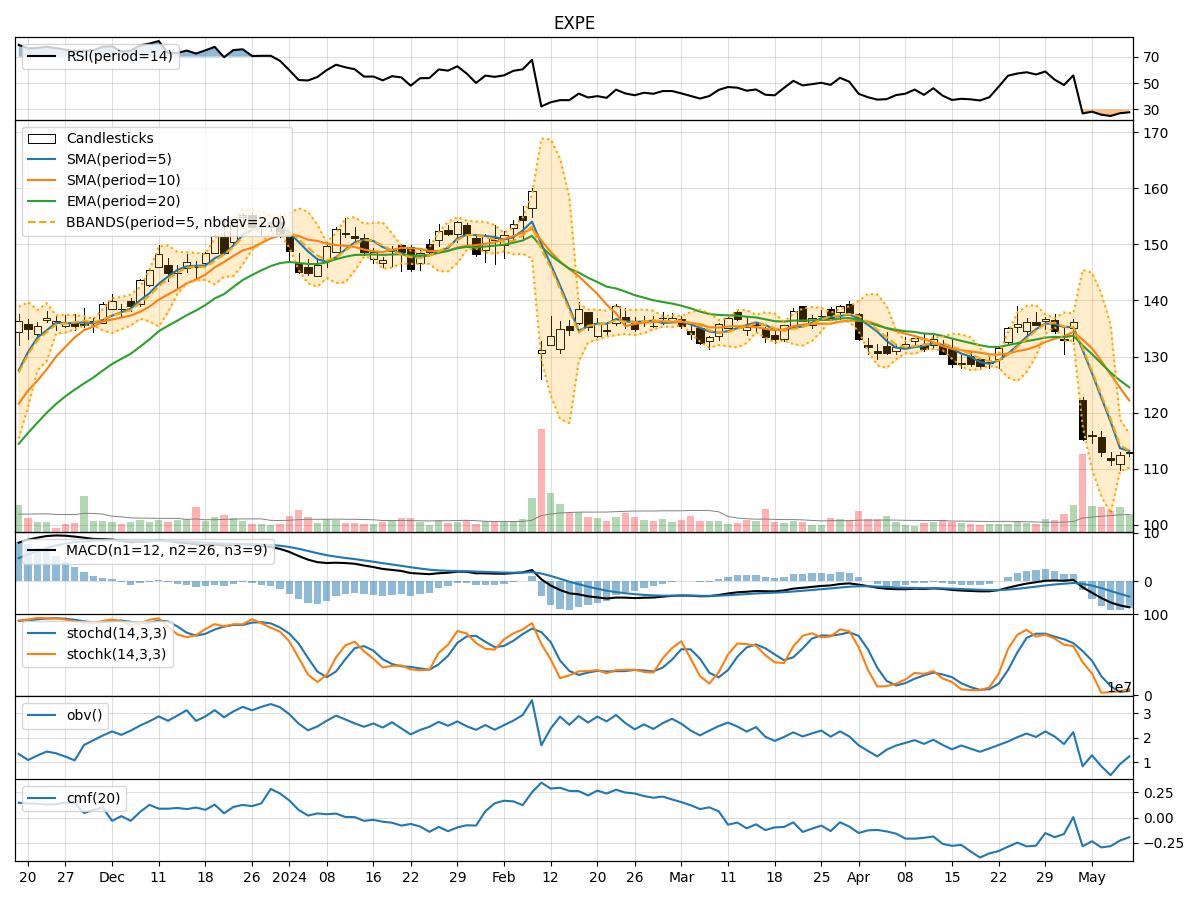
- Moving Averages (MA): The 5-day Moving Average (MA) has been consistently below the Simple Moving Average (SMA) and Exponential Moving Average (EMA), indicating a downward trend.
- MACD: The Moving Average Convergence Divergence (MACD) has been negative, with the MACD line below the signal line, suggesting bearish momentum.
- MACD Histogram: The MACD Histogram has been decreasing, indicating a strengthening bearish trend.
Momentum Analysis:
- RSI: The Relative Strength Index (RSI) has been below 30, indicating oversold conditions and potential for a reversal.
- Stochastic Oscillator: Both %K and %D have been in the oversold territory, signaling a potential reversal from the downside.
- Williams %R: The Williams %R has been in the oversold region, suggesting a possible bounce back.
Volatility Analysis:
- Bollinger Bands: The stock price has been consistently trading below the lower Bollinger Band, indicating oversold conditions.
- Bollinger Band Width: The Bollinger Band Width has been widening, suggesting increased volatility in the stock price.
Volume Analysis:
- On-Balance Volume (OBV): The OBV has been declining, indicating selling pressure in the stock.
- Chaikin Money Flow (CMF): The CMF has been negative, reflecting a lack of buying interest in the stock.
Key Observations:
- The stock is currently in a downtrend based on moving averages and MACD analysis.
- Momentum indicators suggest the stock is oversold and may see a potential reversal.
- Volatility has increased, indicating heightened market uncertainty.
- Volume indicators show selling pressure and a lack of buying interest.
Conclusion:
Based on the technical analysis of EXPE, the stock is currently in a bearish phase with oversold conditions. However, the momentum indicators suggest a potential reversal in the near future. The increased volatility and declining volume indicate a cautious outlook for the stock.
Recommendation:
Considering the oversold conditions and potential for a reversal indicated by momentum indicators, investors should monitor the stock closely for signs of a turnaround. It is advisable to wait for confirmation of a bullish reversal before considering any long positions. Exercise caution in trading EXPE until a clear trend reversal is confirmed.
Disclaimer:
This analysis is based solely on technical indicators and does not take into account fundamental factors or external market influences. It is essential to conduct thorough research and consult with a financial advisor before making any investment decisions.