Technical Analysis of FCEL 2024-05-10
Overview:
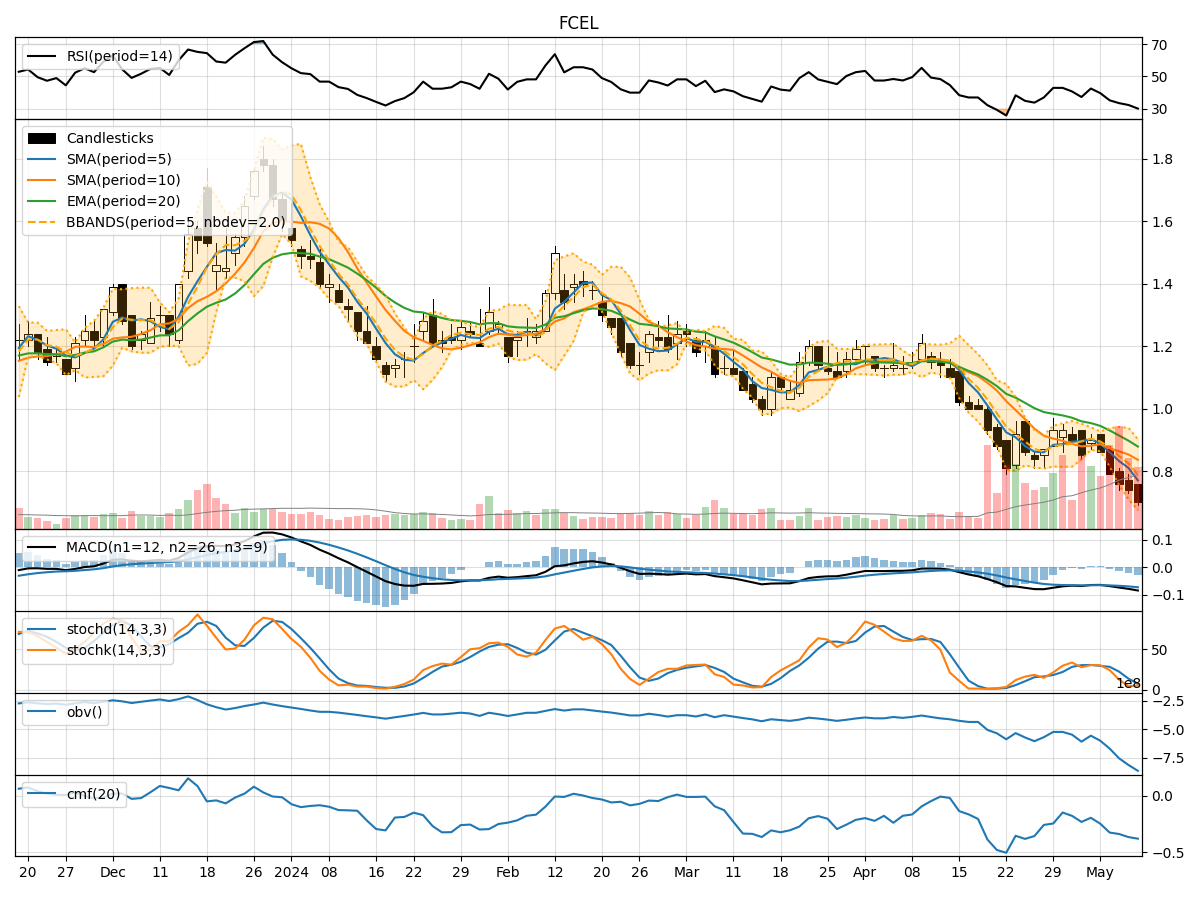
In analyzing the technical indicators for FCEL over the last 5 days, we will delve into the trend, momentum, volatility, and volume indicators to provide a comprehensive outlook on the possible stock price movement. By examining these key aspects, we aim to offer valuable insights and predictions for the upcoming days.
Trend Analysis:
- Moving Averages (MA): The 5-day MA has been consistently decreasing, indicating a downward trend in the stock price.
- MACD: The MACD line has been negative and decreasing, suggesting bearish momentum in the stock.
Momentum Analysis:
- RSI: The RSI has been declining and is currently below 30, indicating oversold conditions.
- Stochastic Oscillator: Both %K and %D have been decreasing, signaling a bearish momentum.
Volatility Analysis:
- Bollinger Bands (BB): The stock price has been consistently below the lower Bollinger Band, indicating oversold conditions.
Volume Analysis:
- On-Balance Volume (OBV): The OBV has been consistently decreasing, reflecting selling pressure in the stock.
- Chaikin Money Flow (CMF): The CMF has been negative, indicating a lack of buying interest.
Key Observations:
- The stock is in a strong downtrend based on moving averages and MACD.
- Momentum indicators like RSI and Stochastic Oscillator suggest oversold conditions.
- Volatility indicators show the stock is below the lower Bollinger Band, indicating potential for a reversal.
- Volume indicators reflect significant selling pressure and a lack of buying interest.
Conclusion:
Based on the analysis of technical indicators, the stock is currently in a bearish trend with oversold conditions. However, the stock being below the lower Bollinger Band suggests a potential reversal or consolidation in the near future. Short-term price movement may see a bounce or consolidation, but the overall trend remains bearish. Traders should exercise caution and wait for confirmation of a trend reversal before considering long positions.