Technical Analysis of FFIN 2024-05-31
Overview:
In analyzing the technical indicators for FFIN over the last 5 days, we will delve into the trend, momentum, volatility, and volume indicators to provide a comprehensive outlook on the possible stock price movement. By examining these key aspects, we aim to offer valuable insights and predictions for the upcoming days.
Trend Analysis:
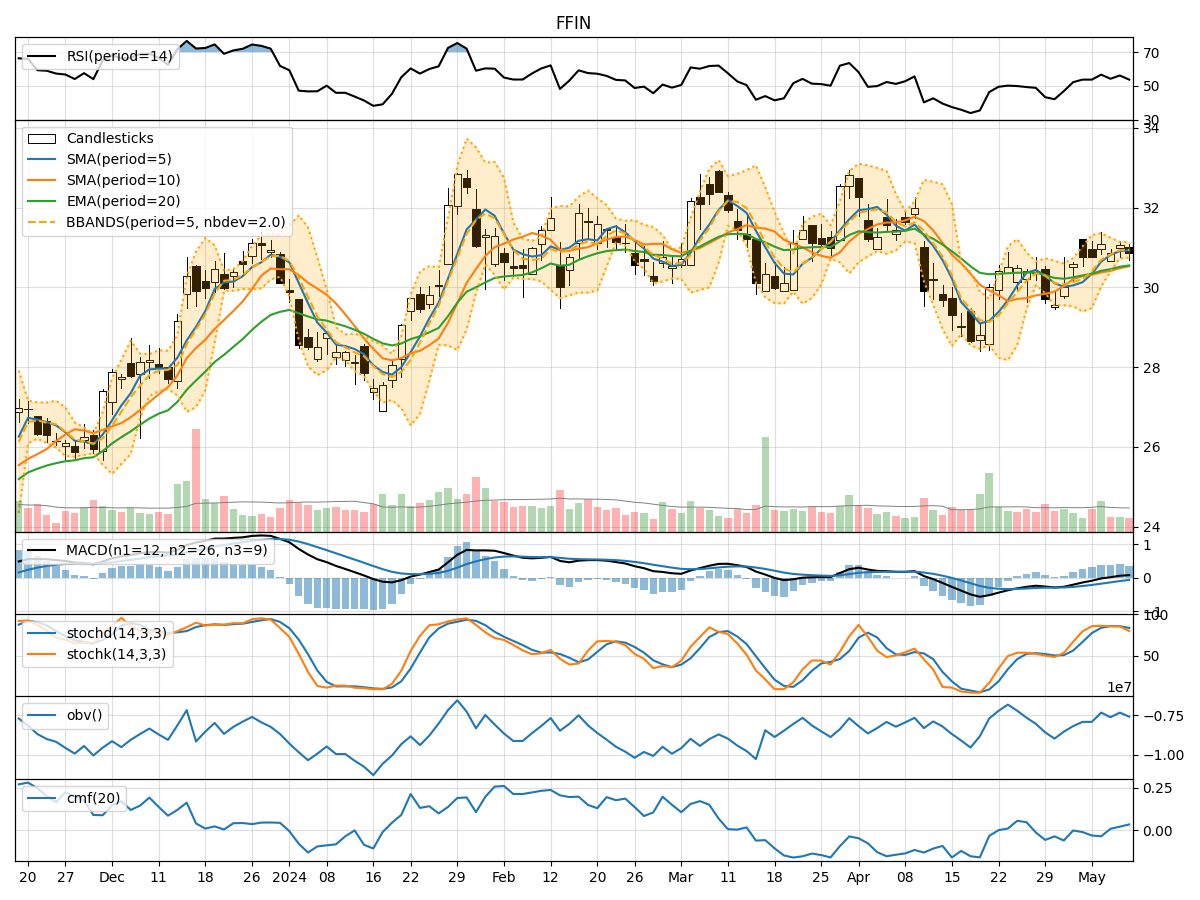
- Moving Averages (MA): The 5-day MA has been consistently below the closing price, indicating a short-term downtrend.
- MACD: The MACD line has been below the signal line, suggesting a bearish momentum.
- EMA: The EMA has been declining, further supporting the bearish trend.
Momentum Analysis:
- RSI: The RSI has been fluctuating around the mid-level, indicating indecision in the market.
- Stochastic Oscillator: Both %K and %D have been hovering in oversold territory, signaling a potential reversal.
- Williams %R: The indicator has been in oversold territory, suggesting a possible buying opportunity.
Volatility Analysis:
- Bollinger Bands (BB): The stock price has been trading within the bands, indicating a period of consolidation.
- BB Width: The narrowing of the bands suggests decreasing volatility.
- BB %B: The %B indicator has been fluctuating around the mid-level, reflecting uncertainty in price direction.
Volume Analysis:
- On-Balance Volume (OBV): The OBV has been fluctuating, indicating mixed buying and selling pressure.
- Chaikin Money Flow (CMF): The CMF has been negative, suggesting outflow of money from the stock.
Key Observations:
- The trend indicators point towards a bearish sentiment in the short term.
- Momentum indicators show mixed signals with a potential for a reversal.
- Volatility indicators suggest a period of consolidation and decreasing volatility.
- Volume indicators reflect uncertainty and mixed market participation.
Conclusion:
Based on the analysis of the technical indicators, the next few days for FFIN are likely to see sideways movement with a potential for a bullish reversal. Traders should closely monitor the stochastic oscillator for a confirmation of the reversal signal. Additionally, keeping an eye on the RSI for a sustained move above the mid-level could indicate a shift towards bullish momentum. It is crucial to exercise caution and wait for clear confirmation signals before making any trading decisions.