Technical Analysis of FTNT 2024-05-10
Overview:
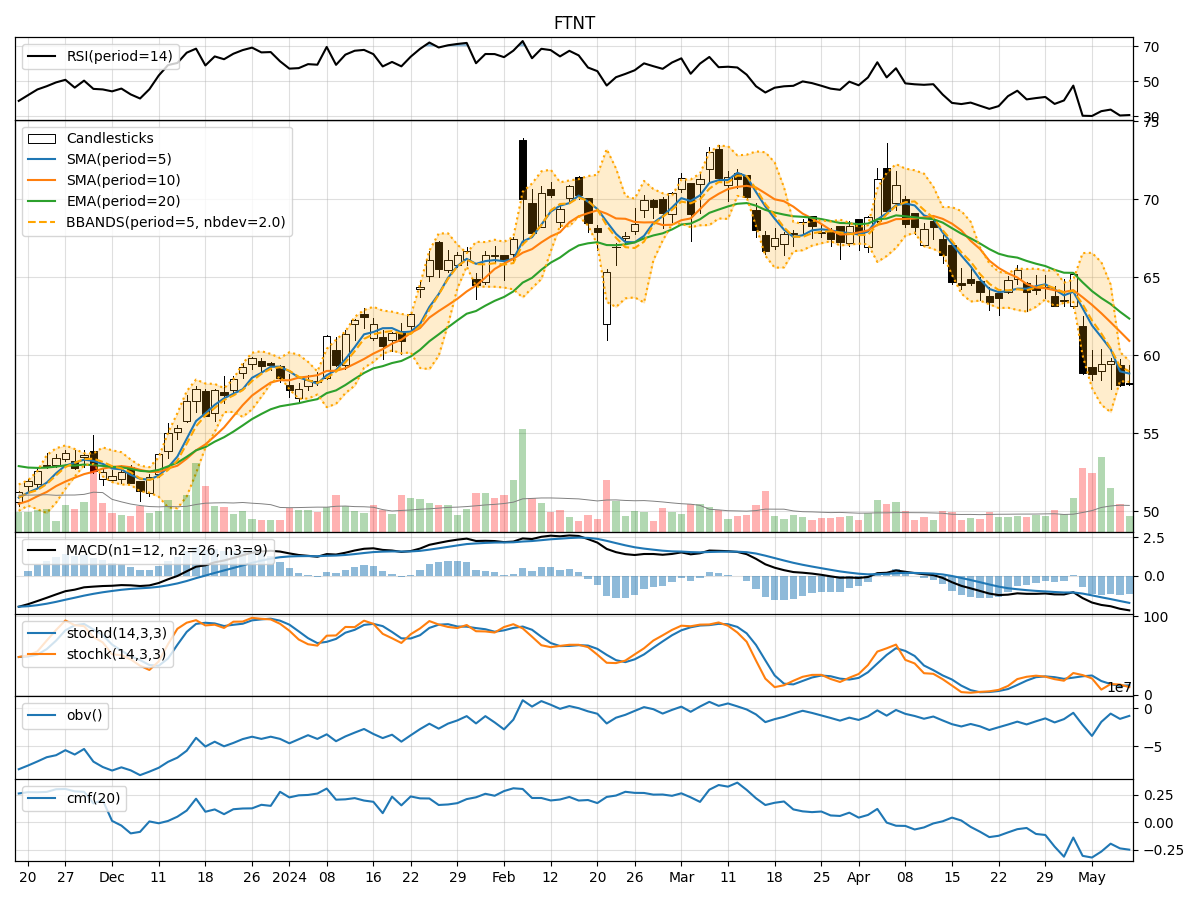
In analyzing the technical indicators for FTNT over the last 5 days, we will delve into the trend, momentum, volatility, and volume indicators to provide a comprehensive outlook on the possible stock price movement in the coming days. By examining these key indicators, we aim to offer valuable insights and predictions for informed decision-making.
Trend Analysis:
- Moving Averages (MA): The 5-day MA has been consistently below the 10-day SMA and 20-day EMA, indicating a short-term bearish trend.
- Moving Average Convergence Divergence (MACD): The MACD line has been below the signal line, with negative values, suggesting a bearish momentum.
- Conclusion: The trend indicators point towards a downward trend for FTNT.
Momentum Analysis:
- Relative Strength Index (RSI): The RSI values have been below 50, indicating a bearish momentum.
- Stochastic Oscillator: Both %K and %D values have been trending lower, reflecting a weakening momentum.
- Conclusion: Momentum indicators support a bearish outlook for FTNT.
Volatility Analysis:
- Bollinger Bands (BB): The stock price has been trading below the lower Bollinger Band, indicating oversold conditions.
- Conclusion: Volatility indicators suggest a potential reversal or consolidation in the near term.
Volume Analysis:
- On-Balance Volume (OBV): The OBV values have been negative, indicating distribution and selling pressure.
- Chaikin Money Flow (CMF): The CMF values have been consistently negative, signaling a lack of buying interest.
- Conclusion: Volume indicators point towards bearish sentiment and lack of buying support.
Conclusion:
Based on the analysis of trend, momentum, volatility, and volume indicators, the overall outlook for FTNT in the next few days is bearish. The stock is likely to experience further downward movement, potentially reaching lower support levels. Traders and investors should exercise caution and consider shorting or staying on the sidelines until a clear reversal pattern emerges.
Key Takeaways:
- The technical indicators collectively suggest a downward trajectory for FTNT.
- The stock is currently in a bearish phase, with momentum and volume supporting the negative sentiment.
- Traders should monitor key support levels and wait for signs of a trend reversal before considering long positions.
Disclaimer:
This analysis is based solely on technical indicators and historical data. Market conditions can change rapidly, and unforeseen events may impact stock prices. It is crucial to conduct thorough research and consider other factors before making investment decisions. Consulting with a financial advisor is recommended for personalized guidance tailored to individual risk tolerance and investment goals.