Technical Analysis of GFS 2024-05-10
Overview:
In analyzing the technical indicators for GFS over the last 5 days, we will delve into the trend, momentum, volatility, and volume indicators to provide a comprehensive outlook on the possible stock price movement in the coming days. By examining these key indicators, we aim to offer valuable insights and predictions to guide your investment decisions.
Trend Analysis:
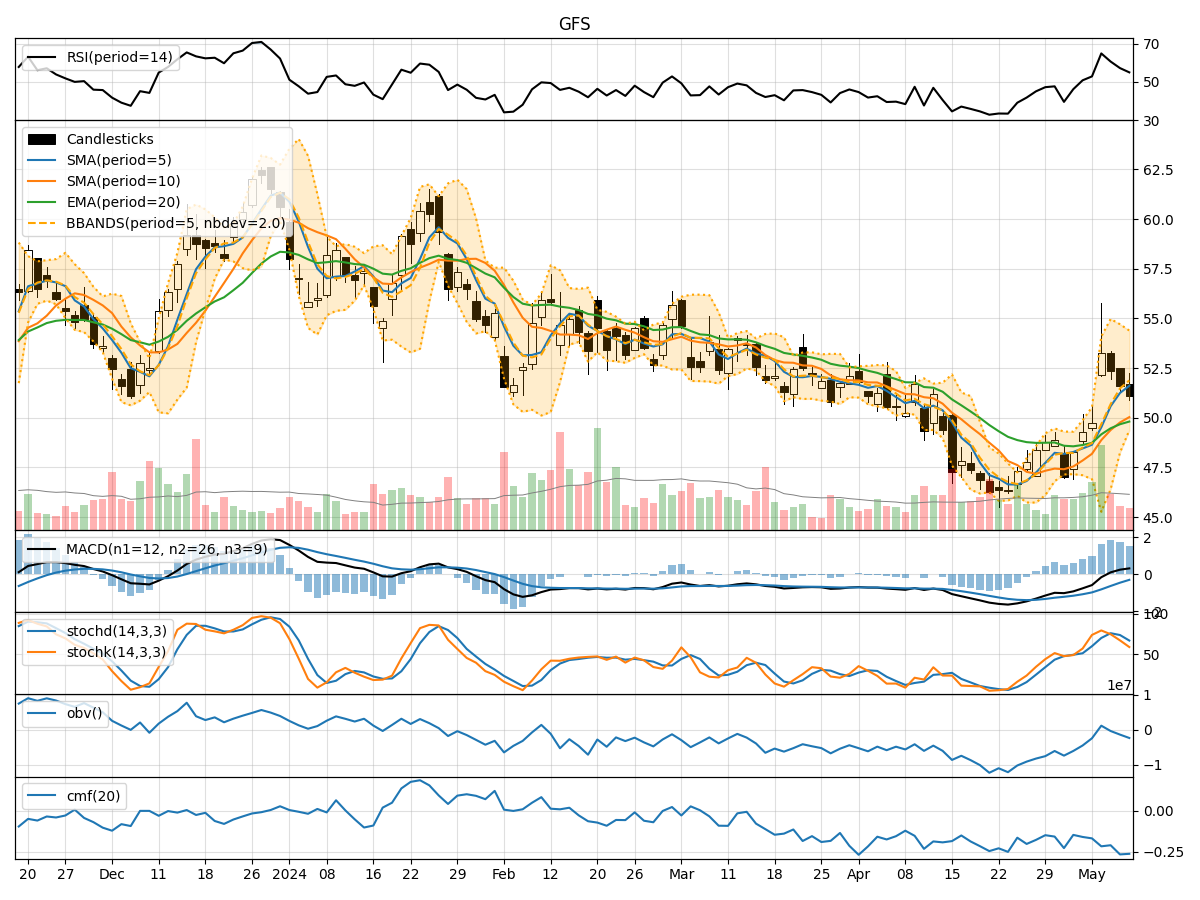
- Moving Averages (MA): The 5-day Moving Average has been consistently increasing, indicating a bullish trend in the short term.
- MACD: The MACD line has been positive and rising, suggesting upward momentum in the stock price.
- RSI: The Relative Strength Index has been above 50, indicating bullish momentum in the stock.
Key Observation: The trend indicators point towards a bullish sentiment in the stock price.
Momentum Analysis:
- RSI: The RSI has been consistently above 50, indicating strong buying momentum.
- Stochastic Oscillator: Both %K and %D have been in the overbought zone, suggesting potential for a pullback.
- Williams %R: The Williams %R has been in the oversold territory, indicating a possible reversal.
Key Observation: Momentum indicators suggest a mixed sentiment with potential for a short-term pullback.
Volatility Analysis:
- Bollinger Bands: The stock price has been trading within the upper Bollinger Band, indicating high volatility.
- Bollinger %B: The %B value has been fluctuating, suggesting potential price reversals.
- Average True Range (ATR): ATR has shown an increase, indicating rising volatility in the stock.
Key Observation: Volatility indicators signal increased price fluctuations and potential for both upward and downward movements.
Volume Analysis:
- On-Balance Volume (OBV): The OBV has been fluctuating, indicating mixed buying and selling pressure.
- Chaikin Money Flow (CMF): The CMF has been negative, suggesting outflow of money from the stock.
Key Observation: Volume indicators reflect a lack of strong buying interest and potential selling pressure.
Conclusion:
Based on the analysis of trend, momentum, volatility, and volume indicators, the stock price of GFS is likely to experience mixed movements in the coming days. While the trend indicators suggest a bullish sentiment, momentum indicators point towards a potential short-term pullback. Volatility indicators indicate increased price fluctuations, and volume indicators reflect mixed buying and selling pressure.
Key Conclusion: The stock price of GFS may experience sideways consolidation in the near term, with potential for short-term fluctuations. It is advisable to closely monitor key support and resistance levels for potential entry or exit points in the stock.