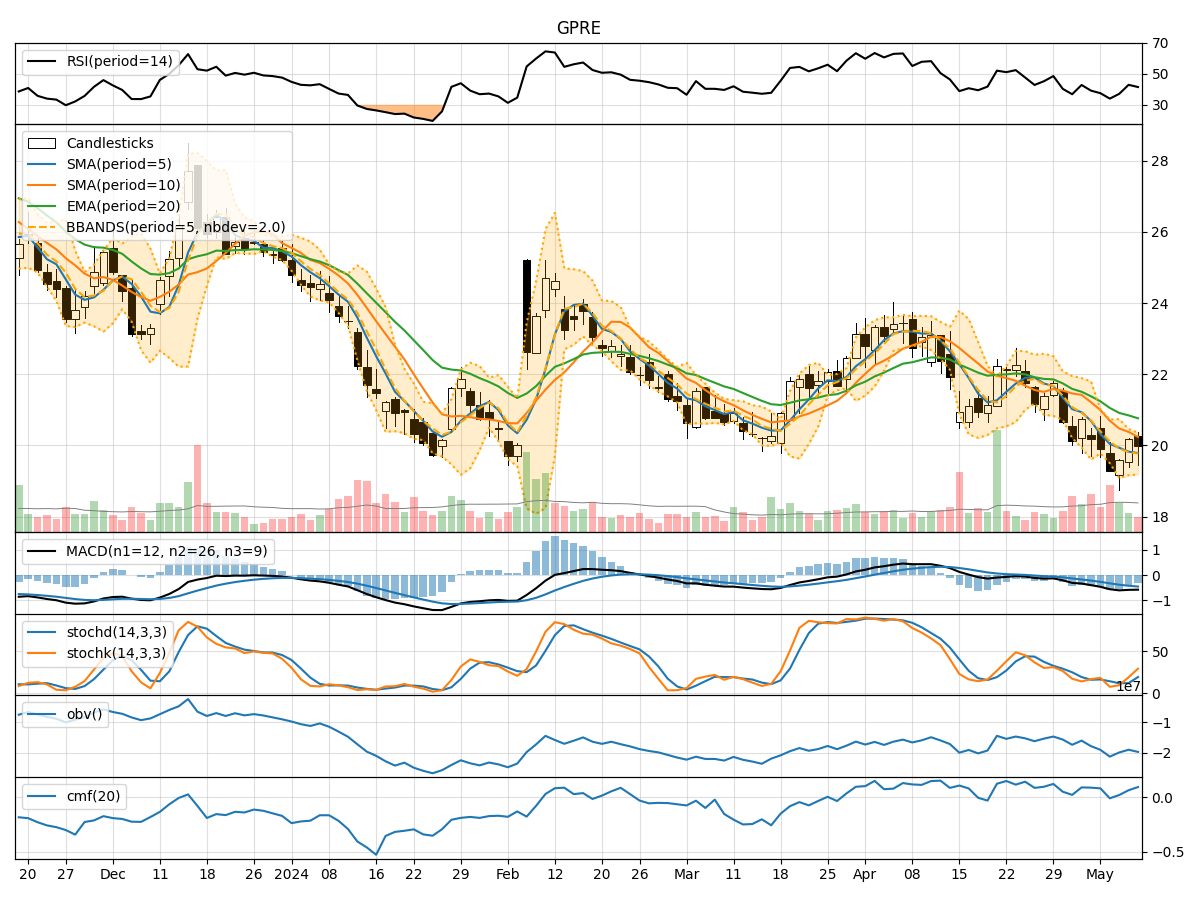
Technical Analysis of GPRE 2024-05-10
Overview:
In analyzing the technical indicators for GPRE over the last 5 days, we will delve into the trend, momentum, volatility, and volume indicators to provide a comprehensive outlook on the possible stock price movement in the coming days.
Trend Analysis:
- Moving Averages (MA): The 5-day MA has been consistently below the closing prices, indicating a short-term downtrend.
- MACD: The MACD line has been below the signal line, suggesting a bearish momentum.
- EMA: The EMA has been trending downwards, reflecting a weakening trend.
Key Observation: The trend indicators point towards a bearish sentiment in the short term.
Momentum Analysis:
- RSI: The RSI has been below 50, indicating a bearish momentum.
- Stochastic Oscillator: Both %K and %D have been below 20, signaling an oversold condition.
- Williams %R: The indicator has been consistently below -80, further confirming the oversold status.
Key Observation: Momentum indicators suggest that the stock is currently oversold and may see a potential reversal.
Volatility Analysis:
- Bollinger Bands (BB): The stock price has been trading below the lower Bollinger Band, indicating oversold conditions.
- Bollinger Band Width (BBW): The BBW has widened, suggesting increased volatility.
- Bollinger Band %B (BBP): The %B is below 0.2, indicating an oversold condition.
Key Observation: Volatility indicators suggest that the stock is currently experiencing high volatility and may see a potential reversal.
Volume Analysis:
- On-Balance Volume (OBV): The OBV has been fluctuating, indicating indecision among investors.
- Chaikin Money Flow (CMF): The CMF has been positive, suggesting buying pressure.
Key Observation: Volume indicators show mixed signals, with the OBV reflecting indecisiveness among investors.
Conclusion:
Based on the analysis of the technical indicators, the stock of GPRE is currently in an oversold condition with bearish trends in the short term. However, the momentum and volatility indicators suggest a potential reversal in the near future. The mixed signals from the volume indicators indicate uncertainty among investors.
Recommendation:
Considering the oversold conditions and potential for a reversal indicated by momentum and volatility indicators, investors should closely monitor the stock for signs of a trend reversal. It is advisable to wait for confirmation of a bullish momentum before considering any long positions. Additionally, keeping an eye on key support and resistance levels can provide valuable insights into the stock's future price movements.