Technical Analysis of HSON 2024-05-31
Overview:
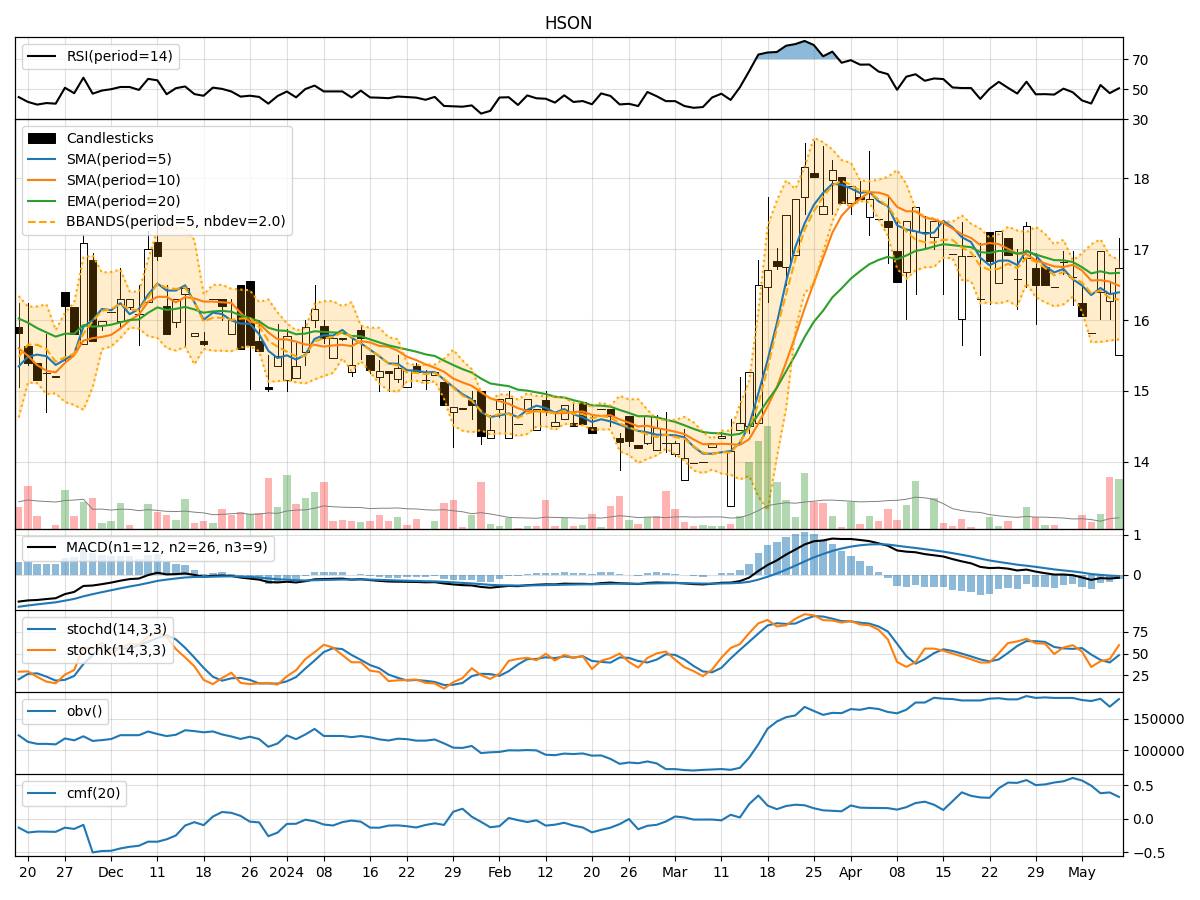
In analyzing the technical indicators for HSON over the last 5 days, we will delve into the trend, momentum, volatility, and volume indicators to provide a comprehensive outlook on the possible stock price movement in the coming days. By examining these key aspects, we aim to offer valuable insights and predictions to guide your investment decisions.
Trend Analysis:
- Moving Averages (MA): The 5-day Moving Average (MA) has been consistently below the Simple Moving Average (SMA) and Exponential Moving Average (EMA), indicating a downward trend.
- MACD: The Moving Average Convergence Divergence (MACD) has been negative, with the MACD line consistently below the signal line, suggesting bearish momentum.
- RSI: The Relative Strength Index (RSI) has been hovering around 40-50, indicating a neutral stance in terms of momentum.
Momentum Analysis:
- Stochastic Oscillator: The Stochastic Oscillator shows values below 50, indicating a bearish momentum.
- Williams %R (WillR): The Williams %R is in oversold territory, suggesting a potential reversal or bounce.
Volatility Analysis:
- Bollinger Bands (BB): The Bollinger Bands have been narrowing, indicating decreasing volatility.
- Average True Range (ATR): The ATR has been relatively stable, suggesting a lack of significant price movements.
Volume Analysis:
- On-Balance Volume (OBV): The OBV has been fluctuating, indicating mixed buying and selling pressure.
- Chaikin Money Flow (CMF): The CMF has been positive, suggesting accumulation in the stock.
Key Observations:
- The trend indicators point towards a downward trend with bearish signals from the MACD and moving averages.
- Momentum indicators suggest a bearish momentum with the Stochastic Oscillator and Williams %R signaling potential oversold conditions.
- Volatility indicators indicate decreasing volatility, which may lead to a period of consolidation.
- Volume indicators show mixed signals with fluctuating OBV and positive CMF, indicating mixed buying and selling pressure.
Conclusion:
Based on the analysis of the technical indicators, the next few days for HSON are likely to see further downward movement in the stock price. The bearish trend, coupled with bearish momentum signals and decreasing volatility, suggests a potential continuation of the current downtrend. Traders and investors should exercise caution and consider short-term strategies or wait for more definitive signals before entering new positions.