Technical Analysis of HTZ 2024-05-10
Overview:
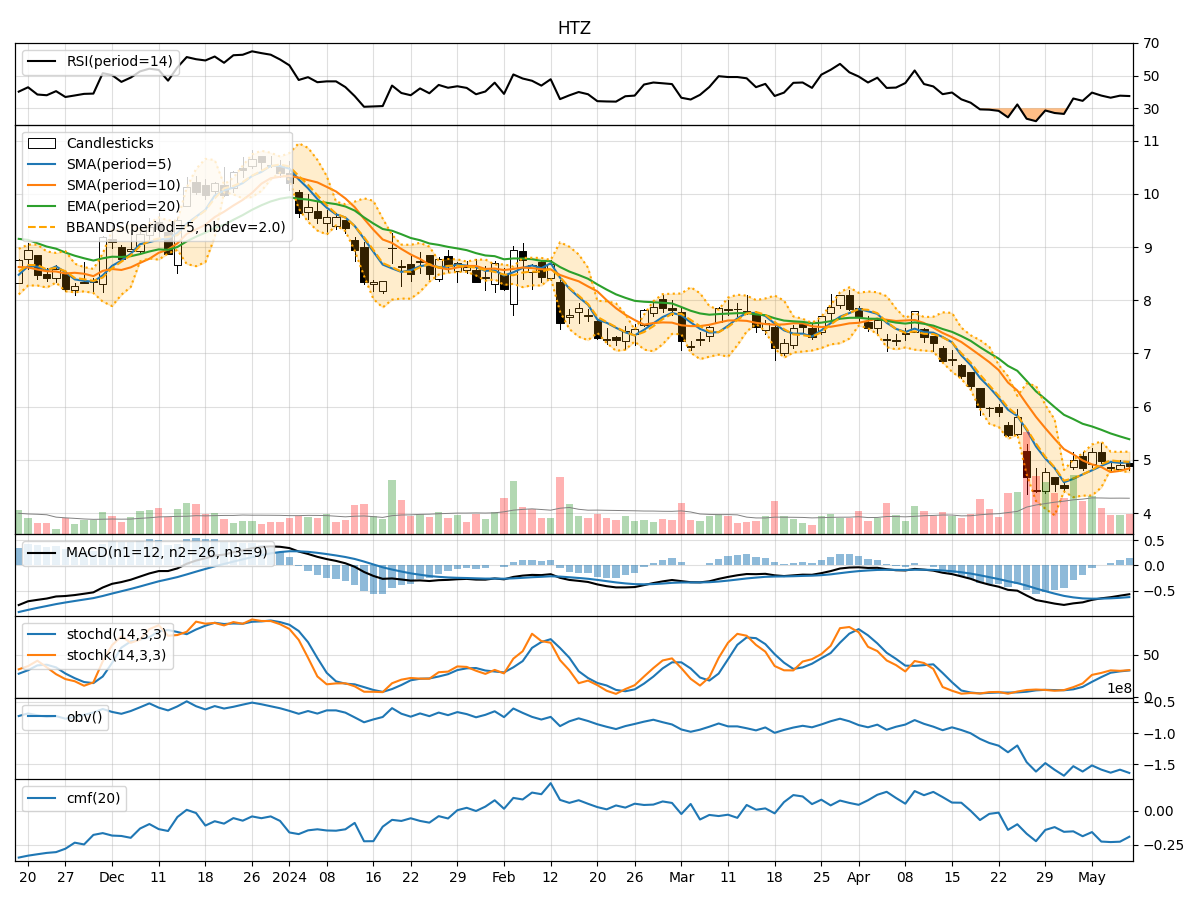
In analyzing the technical indicators for HTZ over the last 5 days, we will delve into the trend, momentum, volatility, and volume indicators to provide a comprehensive outlook on the possible stock price movement. By examining these key aspects, we aim to offer valuable insights and predictions for the upcoming days.
Trend Analysis:
- Moving Averages (MA): The 5-day Moving Average (MA) has been fluctuating around the closing prices, indicating short-term price trends. The Simple Moving Average (SMA) and Exponential Moving Average (EMA) show a downward trend, suggesting bearish sentiment.
- MACD: The Moving Average Convergence Divergence (MACD) has been negative, with the MACD line consistently below the signal line. This indicates a bearish trend in the stock price.
Momentum Analysis:
- RSI: The Relative Strength Index (RSI) has been hovering around 30-40, indicating a slightly oversold condition but still within bearish territory.
- Stochastic Oscillator: Both %K and %D lines of the Stochastic Oscillator are below 50, suggesting downward momentum.
- Williams %R: The Williams %R is in the oversold region, indicating a bearish sentiment.
Volatility Analysis:
- Bollinger Bands (BB): The Bollinger Bands have been narrowing, indicating decreasing volatility. The bands are currently close to the stock price, suggesting a potential breakout in either direction.
- Bollinger %B: The %B indicator is below 1, indicating that the stock price is trading below the lower Bollinger Band, signaling a possible oversold condition.
Volume Analysis:
- On-Balance Volume (OBV): The OBV has been declining, indicating selling pressure in the stock.
- Chaikin Money Flow (CMF): The CMF has been negative, suggesting that money is flowing out of the stock.
Conclusion:
Based on the analysis of the technical indicators, the overall outlook for HTZ in the next few days appears bearish. The trend indicators, momentum oscillators, and volume indicators all point towards a continuation of the downward trend. The narrowing Bollinger Bands and oversold conditions in various indicators suggest a possible consolidation or temporary price stabilization before a potential further decline.
Key Points: - Direction: Downward - Momentum: Bearish - Volatility: Decreasing - Volume: Selling Pressure
Investors should exercise caution and consider waiting for more definitive signals before considering any long positions. Monitoring key support levels and waiting for signs of a reversal in the technical indicators would be prudent before making any trading decisions.