Technical Analysis of INTC 2024-05-10
Overview:
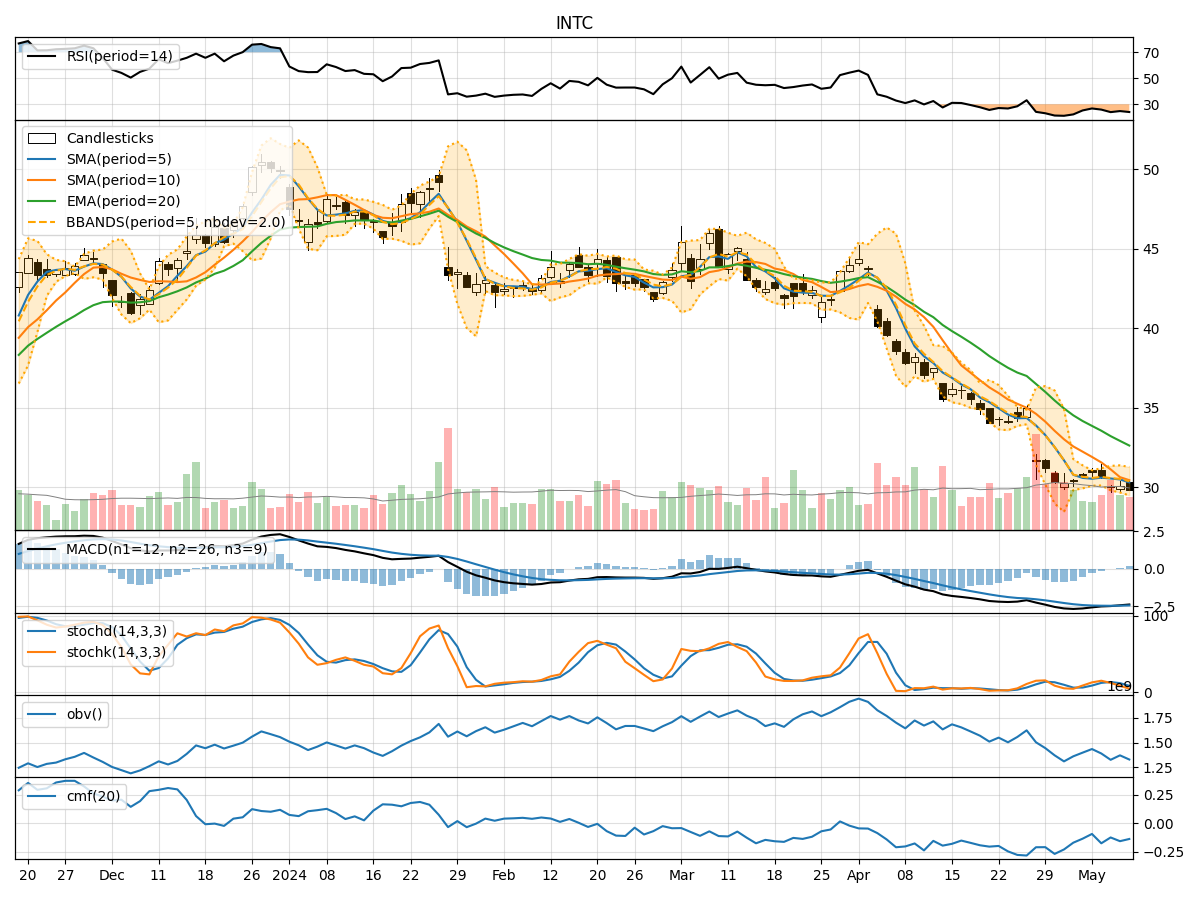
In analyzing the technical indicators for INTC over the last 5 days, we will delve into the trend, momentum, volatility, and volume indicators to provide a comprehensive outlook on the possible stock price movement in the coming days.
Trend Indicators:
- Moving Averages (MA): The 5-day MA has been consistently below the longer-term SMAs and EMAs, indicating a downward trend in the stock price.
- MACD: The MACD line has been decreasing, with the MACD line consistently below the signal line, suggesting bearish momentum.
- Conclusion: The trend indicators point towards a downward trend in the stock price.
Momentum Indicators:
- RSI: The RSI has been decreasing, indicating weakening momentum in the stock.
- Stochastic Oscillator: Both %K and %D have been declining, showing a bearish momentum.
- Conclusion: Momentum indicators suggest a bearish sentiment in the stock.
Volatility Indicators:
- Bollinger Bands (BB): The stock price has been consistently below the middle BB, indicating a lower volatility period.
- Conclusion: Volatility indicators suggest a low volatility environment for the stock.
Volume Indicators:
- On-Balance Volume (OBV): The OBV has been consistently negative, indicating selling pressure in the stock.
- Chaikin Money Flow (CMF): The CMF has been negative, suggesting outflow of money from the stock.
- Conclusion: Volume indicators point towards bearish sentiment with selling pressure.
Conclusion:
Based on the analysis of trend, momentum, volatility, and volume indicators, the overall outlook for INTC in the next few days is bearish. The stock is likely to experience further downward movement in the coming days. Traders and investors should exercise caution and consider shorting or staying away from long positions until a reversal in the indicators is observed.
Key Points:
- Direction: Downward
- Recommendation: Bearish
- Action: Consider short positions or staying on the sidelines until a reversal is confirmed.
As a leading technical analyst, it is crucial to interpret the data objectively and make informed decisions based on the prevailing market conditions. Always remember to monitor the indicators regularly for any potential shifts in the stock's trajectory.