Technical Analysis of KMDA 2024-05-31
Overview:
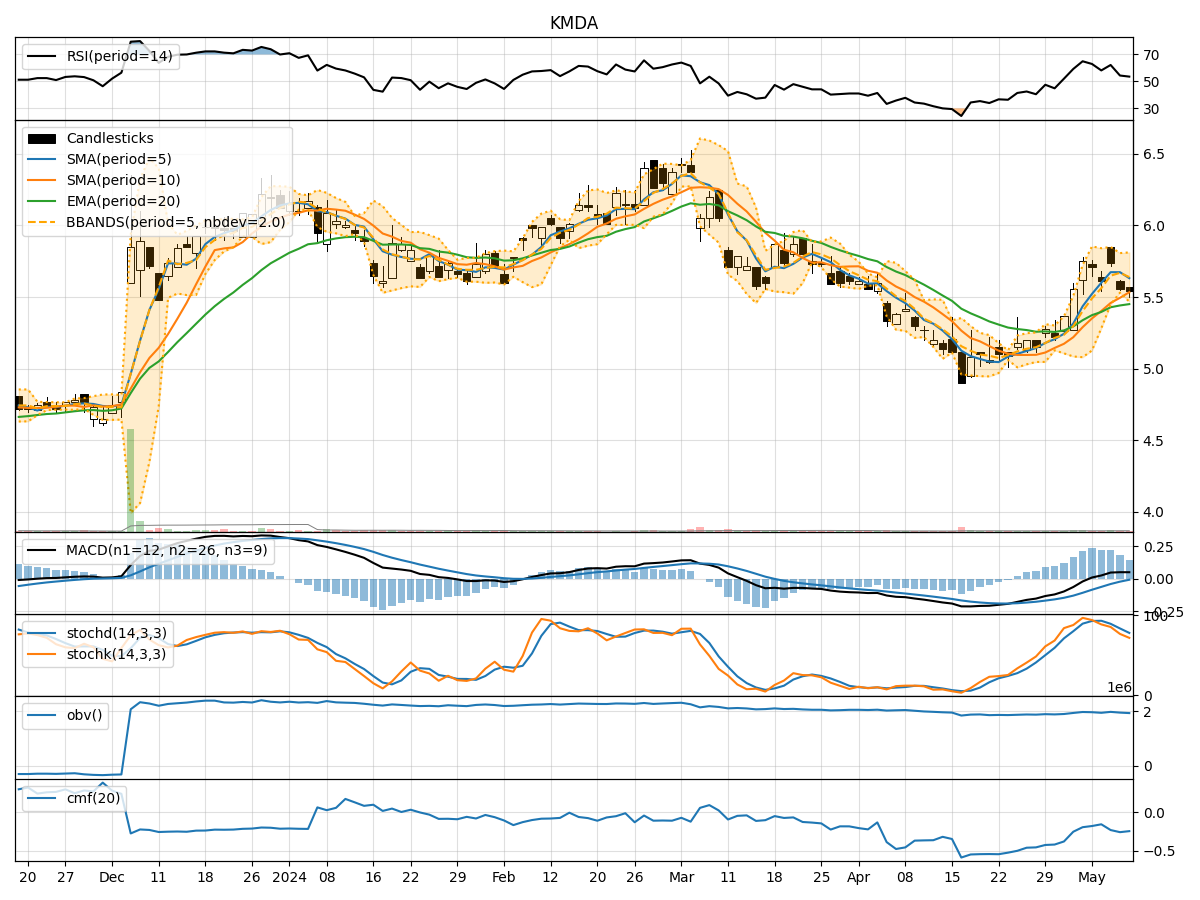
In analyzing the technical indicators for KMDA over the last 5 days, we will delve into the trend, momentum, volatility, and volume indicators to provide a comprehensive outlook on the possible stock price movement. By examining these key aspects, we aim to offer valuable insights and predictions for the upcoming days.
Trend Analysis:
- Moving Averages (MA): The 5-day Moving Average (MA) has been declining gradually, indicating a short-term bearish trend.
- MACD: The Moving Average Convergence Divergence (MACD) has been consistently negative, suggesting downward momentum in the stock price.
- EMA: The Exponential Moving Average (EMA) has also been trending downwards, aligning with the bearish sentiment in the short to mid-term.
Momentum Analysis:
- RSI: The Relative Strength Index (RSI) has been hovering around the oversold territory, indicating a potential reversal or continuation of the downtrend.
- Stochastic Oscillator: Both %K and %D have been relatively low, signaling a potential oversold condition and a possible upcoming bullish momentum.
- Williams %R: The Williams %R is deeply in the oversold region, suggesting a potential reversal or bounce in the stock price.
Volatility Analysis:
- Bollinger Bands (BB): The Bollinger Bands have been narrowing, indicating decreasing volatility and a possible period of consolidation.
- BB% (Bollinger Band %B): The %B indicator has been decreasing, suggesting a potential consolidation phase or a period of ranging prices.
Volume Analysis:
- On-Balance Volume (OBV): The OBV has been declining, indicating selling pressure and a potential bearish sentiment among investors.
- Chaikin Money Flow (CMF): The CMF has been relatively stable but trending slightly downwards, suggesting a decrease in buying pressure.
Conclusion:
Based on the analysis of the technical indicators, the stock of KMDA is currently in a downtrend with bearish momentum. The volatility is decreasing, indicating a possible period of consolidation or sideways movement in the upcoming days. The volume indicators suggest a bearish sentiment among investors.
Forecast:
Considering the overall bearish trend and momentum, it is likely that KMDA's stock price will continue to face downward pressure in the short term. Traders and investors should exercise caution and consider waiting for more definitive signals of a trend reversal before considering long positions.