Technical Analysis of KOPN 2024-05-10
Overview:
In analyzing the technical indicators for KOPN over the last 5 days, we will delve into the trend, momentum, volatility, and volume indicators to provide a comprehensive assessment of the stock's potential price movement. By examining these key factors, we aim to offer valuable insights and predictions for the next few days.
Trend Analysis:
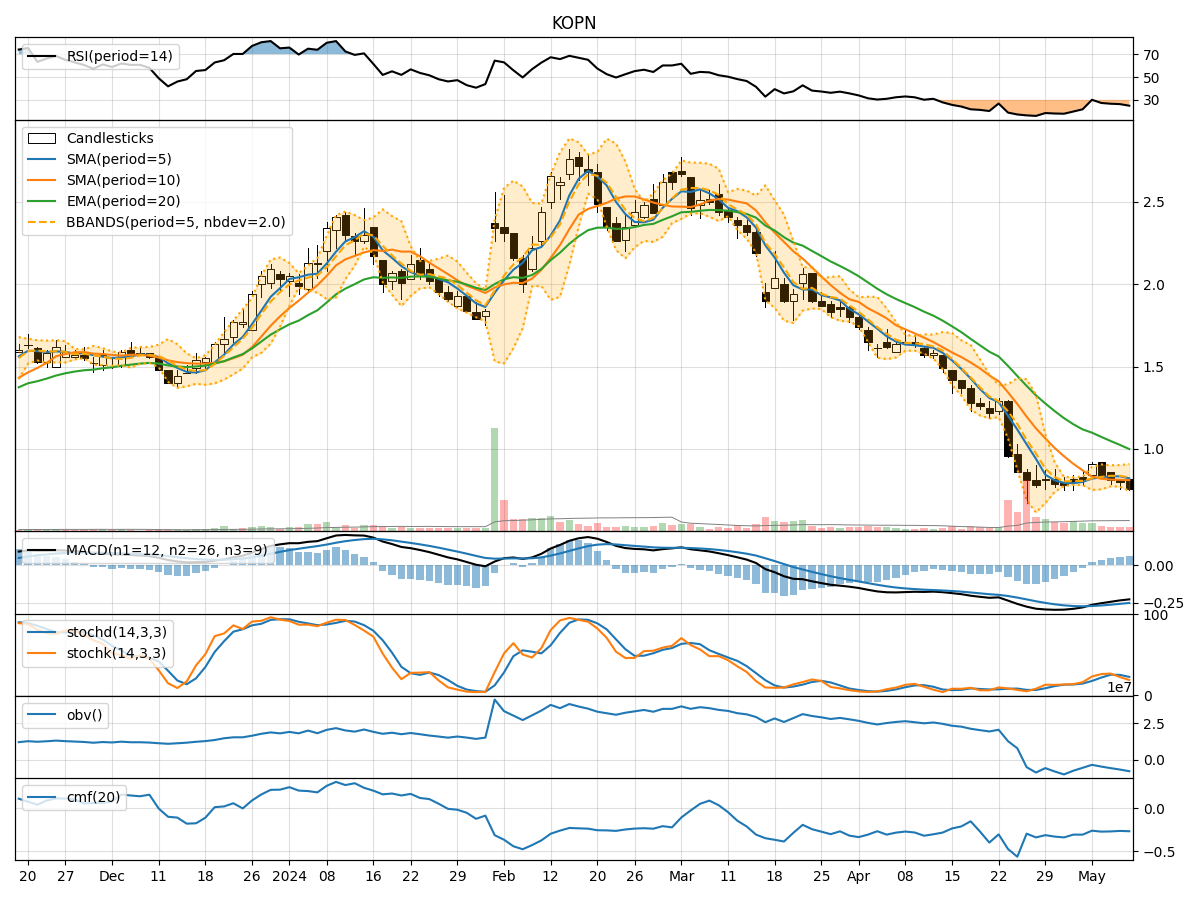
- The moving averages (MA) show a declining trend, with the 5-day MA consistently below the 10-day simple moving average (SMA).
- The exponential moving average (EMA) also indicates a downward trend, with the stock price below the 20-day EMA.
- The Moving Average Convergence Divergence (MACD) is negative, suggesting bearish momentum in the short term.
Momentum Analysis:
- The Relative Strength Index (RSI) is below 30, indicating oversold conditions and potential for a reversal.
- The Stochastic Oscillator shows the stock in oversold territory, but the %K and %D lines are trending upwards.
- The Williams %R (WILLR) is in extreme oversold territory, suggesting a possible bounce back.
Volatility Analysis:
- The Bollinger Bands (BB) are narrowing, indicating decreasing volatility in the stock price.
- The %B indicator is below 0.2, signaling potential oversold conditions.
- The Bollinger Band Width (BBW) is decreasing, suggesting a potential breakout or reversal.
Volume Analysis:
- The On-Balance Volume (OBV) is negative, indicating selling pressure in the stock.
- The Chaikin Money Flow (CMF) is also negative, reflecting outflow of money from the stock.
Key Observations:
- The stock is currently in a downtrend based on the moving averages and MACD.
- Momentum indicators suggest oversold conditions, potentially signaling a reversal in the near future.
- Volatility is decreasing, indicating a possible period of consolidation or a breakout.
- Volume indicators show selling pressure and a negative money flow.
Conclusion:
Based on the analysis of the technical indicators, the stock is currently in a downtrend with oversold conditions. However, there are signs of a potential reversal in momentum and a decrease in volatility, which could lead to a sideways consolidation or a bullish reversal in the next few days. Traders should closely monitor key levels and wait for confirmation of a trend reversal before considering any long positions.