Technical Analysis of KRT 2024-05-31
Overview:
In analyzing the technical indicators for KRT stock over the last 5 days, we will delve into the trends, momentum, volatility, and volume aspects to provide a comprehensive outlook on the possible stock price movement in the coming days. By examining key indicators such as moving averages, MACD, RSI, Bollinger Bands, and OBV, we aim to offer valuable insights and predictions for potential price action.
Trend Analysis:
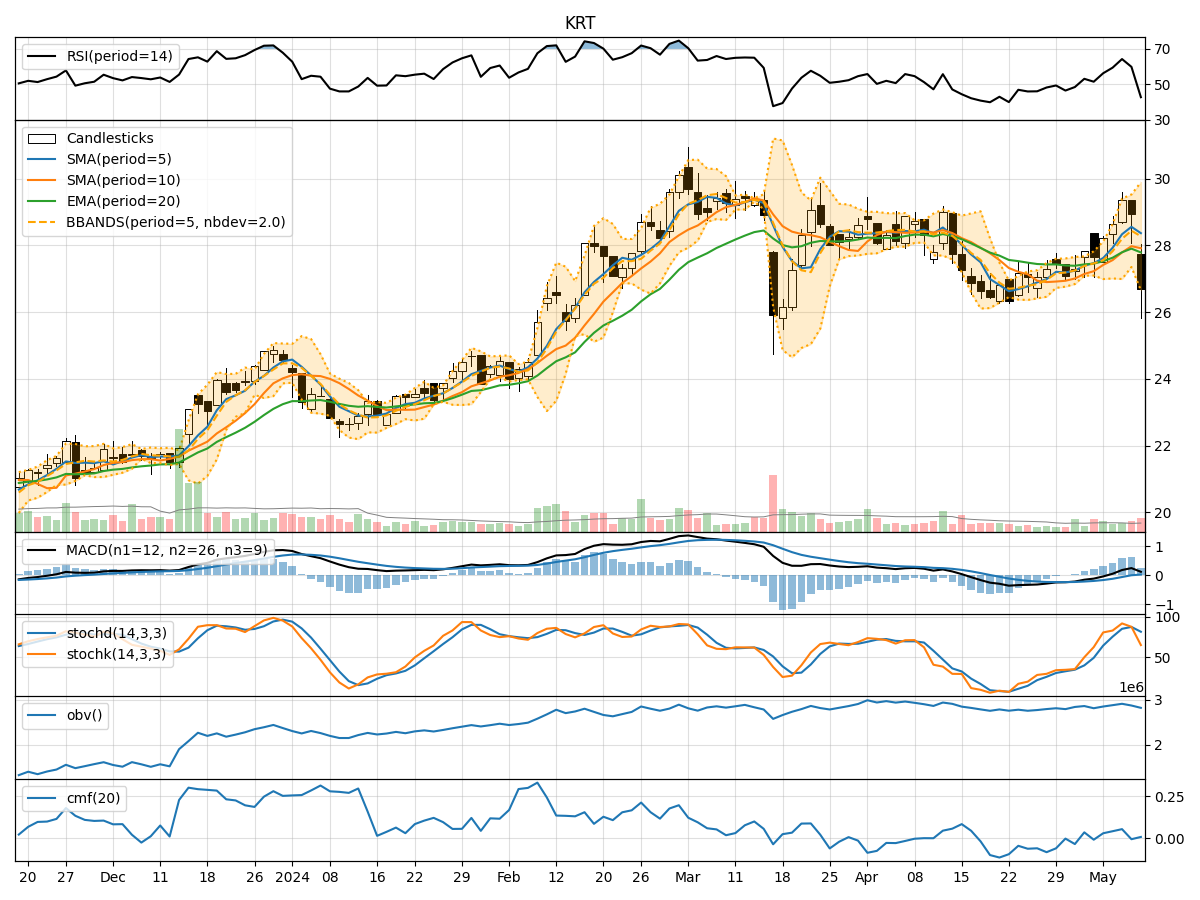
- Moving Averages (MA): The 5-day MA has been fluctuating around the closing prices, indicating short-term price trends. The stock has been trading close to the 5-day MA, suggesting a balanced trend.
- MACD: The MACD line has been consistently positive, indicating a bullish momentum in the stock price.
- EMA: The EMA has been gradually increasing, reflecting a positive trend in the stock price.
Momentum Analysis:
- RSI: The RSI values have been hovering around the mid-range, indicating a neutral momentum in the stock.
- Stochastic Oscillator: Both %K and %D values have been fluctuating, suggesting a lack of clear direction in momentum.
- Williams %R: The Williams %R values have been negative, indicating an oversold condition in the stock.
Volatility Analysis:
- Bollinger Bands: The stock price has been trading within the Bollinger Bands, suggesting a period of consolidation and limited volatility.
- Bollinger %B: The %B values have been relatively stable, indicating a lack of extreme price movements.
Volume Analysis:
- On-Balance Volume (OBV): The OBV values have been increasing, indicating accumulation of the stock by investors.
- Chaikin Money Flow (CMF): The CMF values have been positive, suggesting buying pressure in the stock.
Key Observations:
- The stock is currently in a consolidation phase, trading within a narrow range.
- The bullish momentum indicated by the MACD and EMA signals potential upward movement.
- The neutral RSI and stochastic values suggest a lack of strong momentum in either direction.
- The OBV and CMF values indicate positive volume flow and buying interest in the stock.
Conclusion:
Based on the analysis of the technical indicators, the next few days for KRT stock are likely to see sideways movement with a slight bullish bias. The stock is expected to continue trading within the current range, with a potential for a modest upside as indicated by the MACD and EMA. Traders may consider maintaining a neutral stance or look for buying opportunities on dips, considering the positive volume indicators. It is essential to monitor the price action closely for any signs of a breakout or trend reversal.