Technical Analysis of KURA 2024-05-31
Overview:
In analyzing the technical indicators for KURA over the last 5 days, we will delve into the trend, momentum, volatility, and volume indicators to provide a comprehensive outlook on the possible stock price movement in the coming days. By examining these key indicators, we aim to offer valuable insights and predictions for informed decision-making.
Trend Analysis:
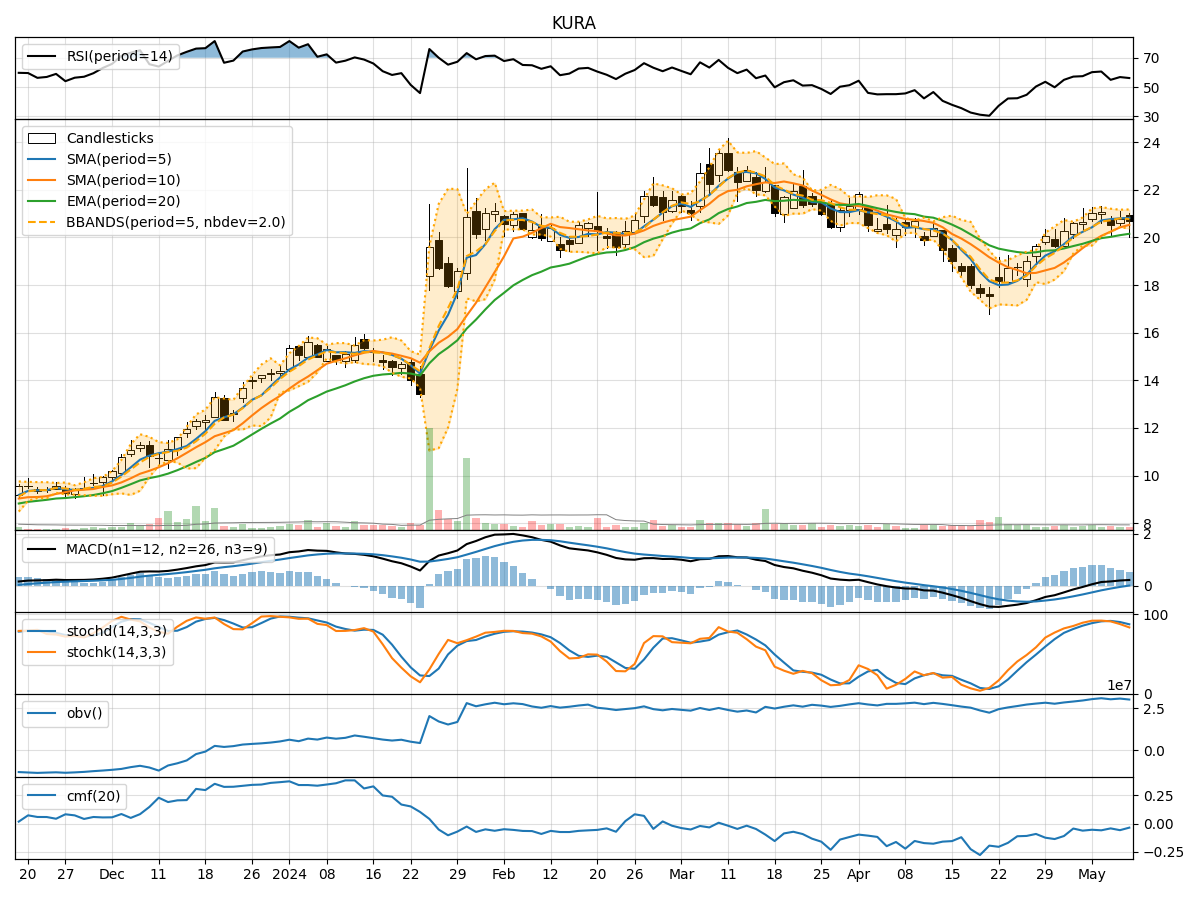
- Moving Averages (MA): The 5-day MA has been consistently below the closing prices, indicating a short-term downtrend.
- MACD: The MACD line has been positive but decreasing, while the MACD Histogram has been declining, suggesting a weakening bullish momentum.
- EMA: The EMA has been trending downwards, reflecting a bearish sentiment in the short to medium term.
Momentum Analysis:
- RSI: The RSI has been hovering around the neutral zone, indicating a lack of strong momentum in either direction.
- Stochastic Oscillator: Both %K and %D have been decreasing, signaling a potential shift towards oversold conditions.
- Williams %R: The indicator has been consistently in oversold territory, suggesting a possible reversal in the near future.
Volatility Analysis:
- Bollinger Bands (BB): The bands have been narrowing, indicating decreasing volatility and a potential period of consolidation.
- BB %B: The %B indicator has been fluctuating within a tight range, reflecting a lack of clear direction in price movement.
Volume Analysis:
- On-Balance Volume (OBV): The OBV has shown mixed signals with no clear trend, suggesting indecision among market participants.
- Chaikin Money Flow (CMF): The CMF has been relatively stable but on the lower side, indicating a lack of strong buying pressure.
Conclusion:
Based on the analysis of the technical indicators, the stock price of KURA is likely to experience further downside movement in the coming days. The trend indicators point towards a bearish sentiment, with the MACD and EMA signaling a weakening bullish momentum. The momentum indicators also support this view, with RSI and Stochastic Oscillator showing signs of potential oversold conditions. Additionally, the volatility indicators suggest a period of consolidation, further supporting a downward bias.
In conclusion, the overall technical outlook for KURA indicates a bearish trajectory in the near term. Traders and investors should exercise caution and consider potential shorting opportunities or wait for a clearer signal before entering any long positions.