Technical Analysis of LYEL 2024-05-10
Overview:
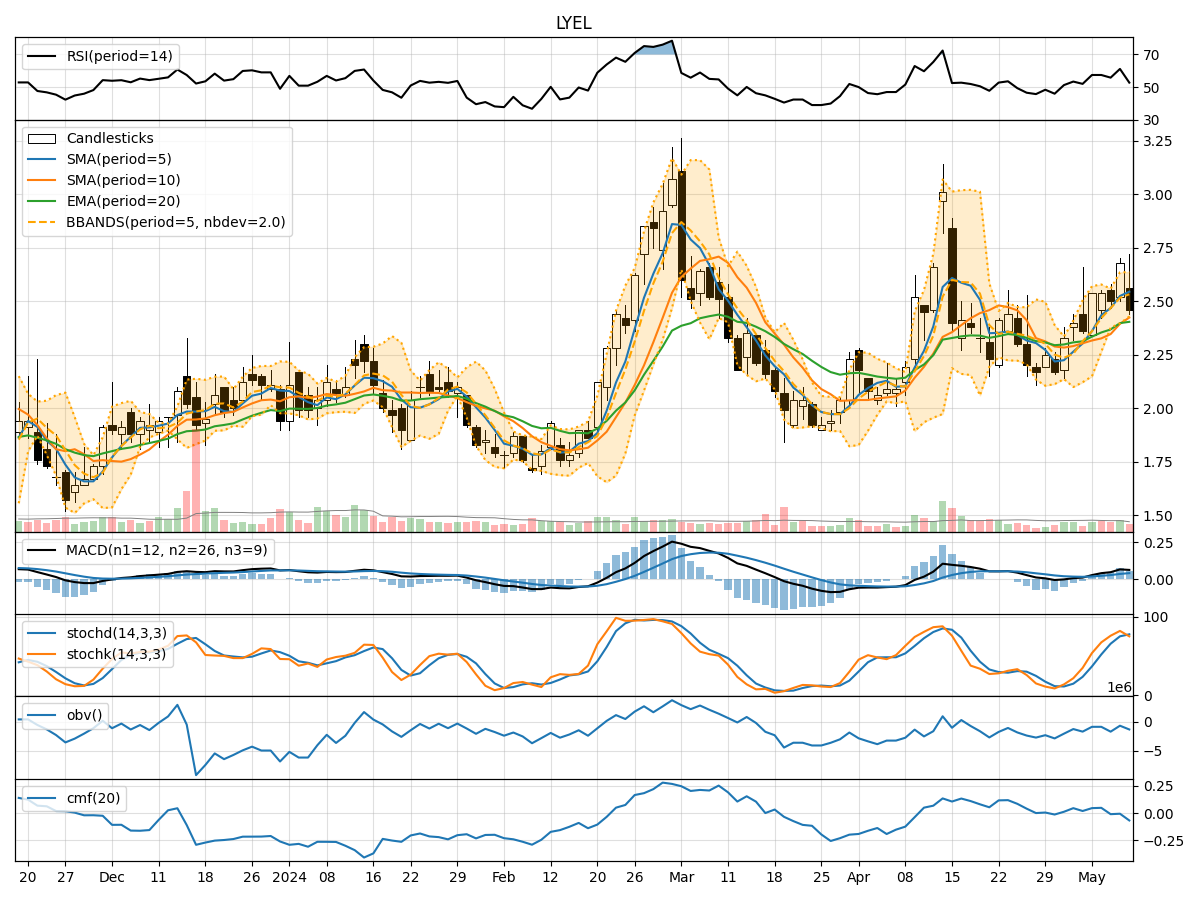
In analyzing the technical indicators for LYEL stock over the last 5 days, we will delve into the trend, momentum, volatility, and volume indicators to provide a comprehensive outlook on the possible stock price movement in the coming days. By examining these key aspects, we aim to offer valuable insights and recommendations for potential investors.
Trend Analysis:
- Moving Averages (MA): The 5-day Moving Average (MA) has been trending upwards, indicating a positive momentum in the stock price.
- MACD: The MACD line has been consistently above the signal line, suggesting a bullish trend in the stock.
- EMA: The Exponential Moving Average (EMA) has been steadily increasing, further supporting the bullish sentiment in the stock.
Key Observation: The trend indicators point towards an upward trajectory for LYEL stock.
Momentum Analysis:
- RSI: The Relative Strength Index (RSI) has been fluctuating but generally staying within the neutral range, indicating a balanced momentum.
- Stochastic Oscillator: Both %K and %D have shown fluctuations but have mostly been in the overbought territory, suggesting a potential reversal in momentum.
- Williams %R: The Williams %R has been in the oversold region, indicating a possible buying opportunity.
Key Observation: The momentum indicators suggest a mixed sentiment with a slight bearish bias.
Volatility Analysis:
- Bollinger Bands: The Bollinger Bands have shown narrowing, indicating decreasing volatility in the stock price.
- Bollinger %B: The %B indicator has been hovering around the middle range, signifying a period of consolidation.
- Average True Range (ATR): The ATR has shown a decrease, further confirming the reduced volatility in the stock.
Key Observation: Volatility indicators suggest a consolidation phase in LYEL stock.
Volume Analysis:
- On-Balance Volume (OBV): The OBV has shown mixed movements, indicating indecision among investors.
- Chaikin Money Flow (CMF): The CMF has been negative, suggesting a net outflow of money from the stock.
Key Observation: Volume indicators reflect a bearish sentiment in LYEL stock.
Conclusion:
Based on the analysis of trend, momentum, volatility, and volume indicators, the overall outlook for LYEL stock in the next few days is as follows: - Trend: Upward - Momentum: Mixed with a Bearish Bias - Volatility: Consolidation - Volume: Bearish
Final Recommendation:
Considering the comprehensive analysis of technical indicators, it is recommended to approach LYEL stock with caution. While the trend suggests a potential upward movement, the mixed momentum and bearish volume indicators indicate a degree of uncertainty and potential downside risk. Investors should closely monitor the stock's price action and wait for more clarity before making any significant investment decisions.