Technical Analysis of MCAG 2024-05-31
Overview:
In analyzing the technical indicators for MCAG stock over the last 5 days, we will delve into the trend, momentum, volatility, and volume indicators to provide a comprehensive outlook on the possible stock price movement in the coming days. By examining these key indicators, we aim to offer valuable insights and predictions to guide your investment decisions.
Trend Analysis:
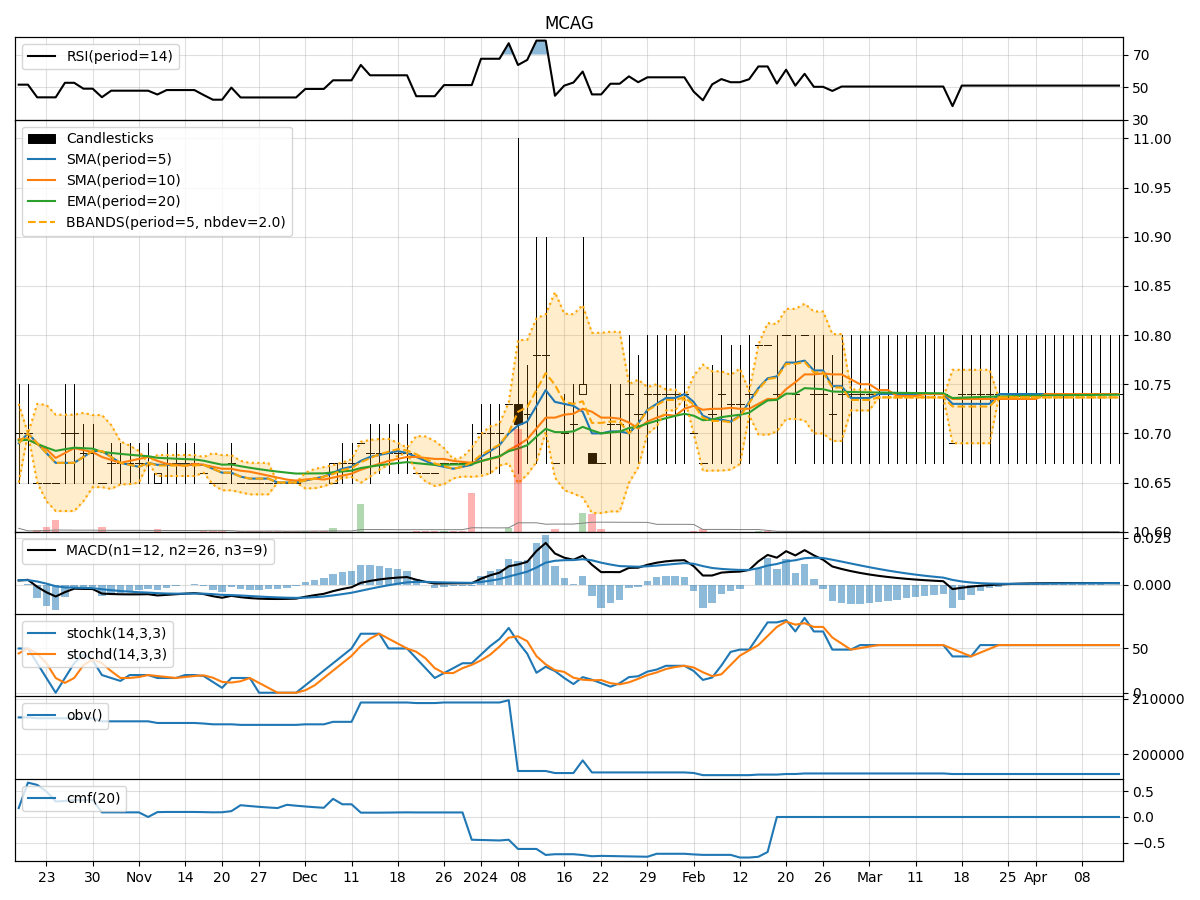
- Moving Averages (MA): The 5-day Moving Average (MA) has been relatively stable around the closing price, indicating a consistent trend.
- MACD: The Moving Average Convergence Divergence (MACD) shows a positive trend with the MACD line consistently above the signal line, suggesting bullish momentum.
- EMA: The Exponential Moving Average (EMA) has been gradually increasing, reflecting a positive price trend.
Momentum Analysis:
- RSI: The Relative Strength Index (RSI) has been hovering around 55-58, indicating a neutral to slightly bullish momentum.
- Stochastic Oscillator: The Stochastic Oscillator shows a decreasing trend in both %K and %D values, signaling a potential reversal in momentum.
- Williams %R: The Williams %R is in oversold territory, suggesting a possible upcoming bullish reversal.
Volatility Analysis:
- Bollinger Bands: The Bollinger Bands have been narrowing, indicating decreasing volatility and a potential price breakout in the near future.
- Bollinger %B: The %B indicator is currently around 1.0, suggesting that the stock price is at the upper Bollinger Band limit.
Volume Analysis:
- On-Balance Volume (OBV): The OBV has been consistently negative, indicating selling pressure in the stock.
- Chaikin Money Flow (CMF): The CMF has been declining, reflecting a decrease in buying pressure and potential bearish sentiment.
Conclusion:
Based on the analysis of the technical indicators, the next few days' possible stock price movement for MCAG is likely to experience a bullish trend. The positive trends in moving averages, MACD, and EMA, coupled with the potential reversal signals in momentum indicators like Stochastic Oscillator and Williams %R, suggest a favorable outlook for price appreciation. However, caution is advised due to the negative OBV and declining CMF, indicating underlying selling pressure. Traders should monitor the narrowing Bollinger Bands for a potential breakout and consider the overall market sentiment for a well-rounded investment decision.