Technical Analysis of MCBC 2024-05-10
Overview:
In analyzing the technical indicators for MCBC stock over the last 5 days, we will delve into the trend, momentum, volatility, and volume indicators to provide a comprehensive outlook on the possible stock price movement in the coming days. By examining these key indicators, we aim to offer valuable insights and predictions for potential investors.
Trend Analysis:
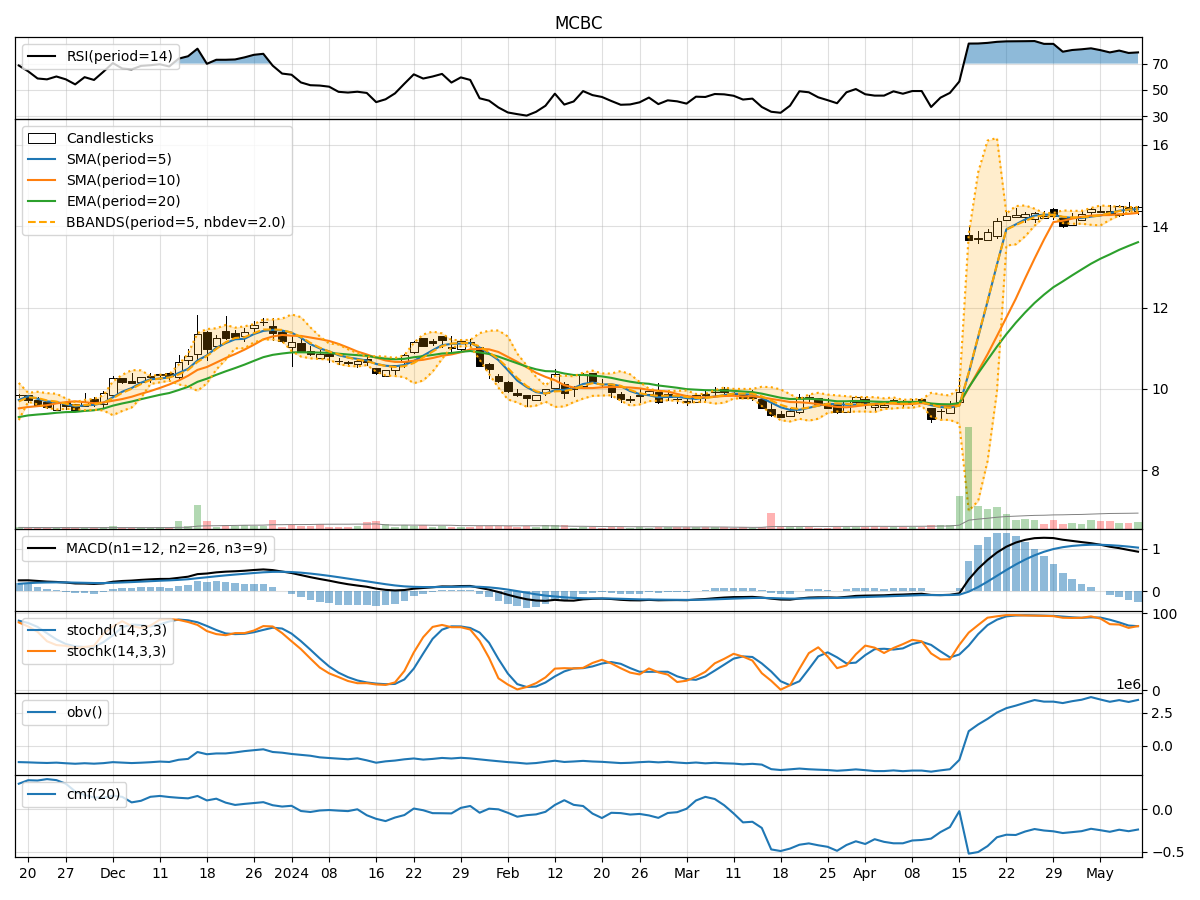
- Moving Averages (MA): The 5-day Moving Average (MA) has been consistently above the Simple Moving Average (SMA) and Exponential Moving Average (EMA), indicating a bullish trend.
- MACD: The MACD line has been above the signal line, suggesting a positive momentum in the stock price.
- MACD Histogram: The MACD Histogram has been decreasing but remains in positive territory, indicating a potential slowdown in the bullish momentum.
Momentum Analysis:
- RSI: The Relative Strength Index (RSI) has been fluctuating around the overbought territory, indicating a strong bullish momentum.
- Stochastic Oscillator: Both %K and %D lines of the Stochastic Oscillator have been relatively high, suggesting an overbought condition.
- Williams %R: The Williams %R indicator has been hovering in the oversold region, signaling a potential reversal in the bullish momentum.
Volatility Analysis:
- Bollinger Bands: The stock price has been trading within the Bollinger Bands, with the bands widening slightly, indicating increased volatility.
- Bollinger %B: The %B indicator has been fluctuating around 0.5, suggesting a neutral stance in terms of volatility.
Volume Analysis:
- On-Balance Volume (OBV): The OBV indicator has been relatively stable, indicating a balance between buying and selling pressure.
- Chaikin Money Flow (CMF): The CMF has been negative, suggesting a slight outflow of money from the stock.
Key Observations:
- The trend indicators point towards a bullish sentiment in the stock price.
- Momentum indicators show a strong bullish momentum but with signs of potential exhaustion.
- Volatility has slightly increased, indicating some uncertainty in the market.
- Volume indicators suggest a balance between buying and selling pressure.
Conclusion:
Based on the analysis of the technical indicators, the next few days' possible stock price movement for MCBC is likely to be sideways with a slight bearish bias. While the trend remains bullish, the momentum indicators show signs of potential exhaustion, and the volatility has increased slightly. The volume indicators also suggest a balance between buying and selling pressure. Therefore, investors should exercise caution and consider potential profit-taking opportunities in the short term.