Technical Analysis of MLKN 2024-05-03
Overview:
In analyzing the technical indicators for MLKN stock over the last 5 days, we will delve into the trend, momentum, volatility, and volume indicators to provide a comprehensive outlook on the possible stock price movement in the coming days. By examining these key indicators, we aim to offer valuable insights and recommendations for potential investors.
Trend Analysis:
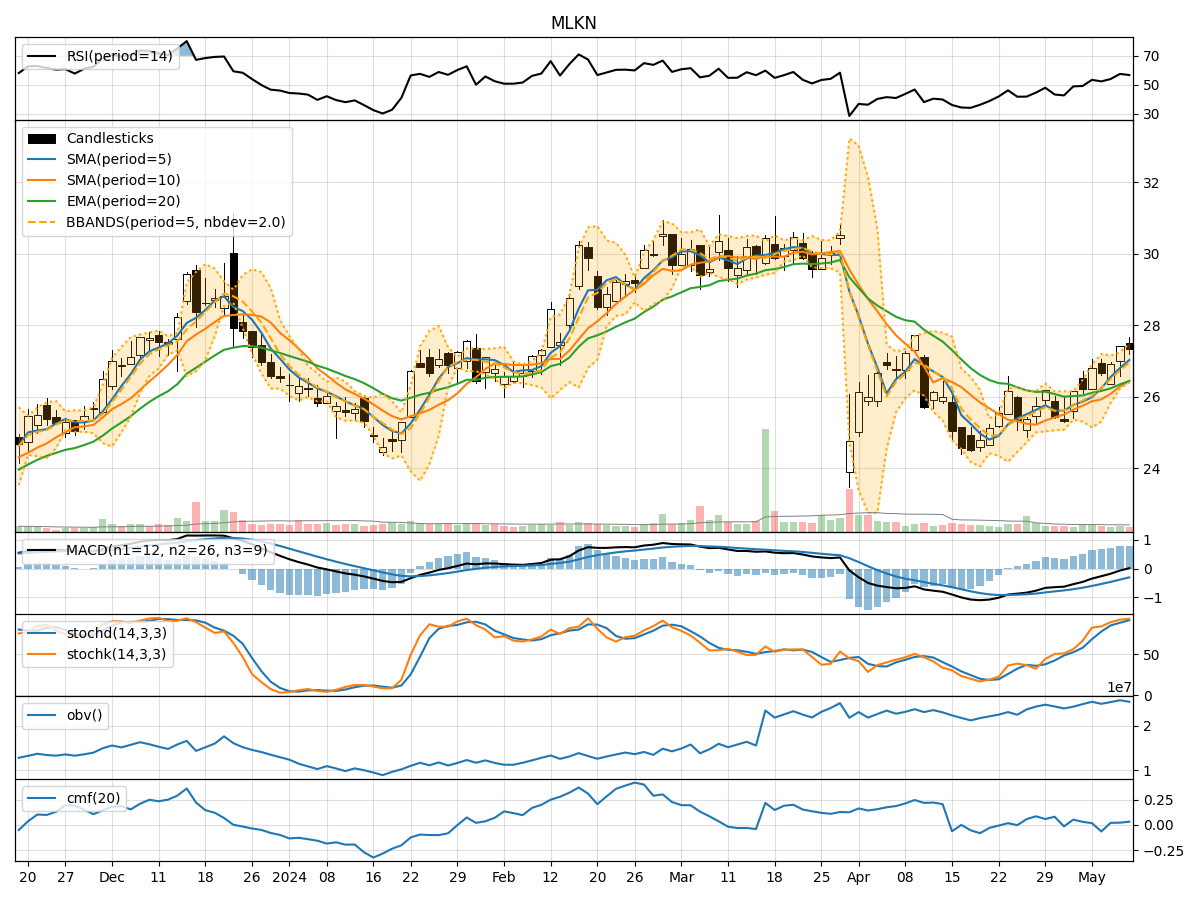
- Moving Averages (MA): The 5-day Moving Average (MA) has been fluctuating around the closing prices, indicating short-term price trends. The Simple Moving Average (SMA) and Exponential Moving Average (EMA) show a mixed trend, with the EMA slightly above the SMA.
- MACD: The Moving Average Convergence Divergence (MACD) has been negative, but the MACD Histogram (MACDH) has shown a slight uptrend, suggesting a potential reversal in the short term.
Momentum Analysis:
- RSI: The Relative Strength Index (RSI) has been hovering around the mid-level, indicating a balanced momentum between buying and selling pressure.
- Stochastic Oscillator: Both %K and %D of the Stochastic Oscillator have been rising, suggesting increasing buying momentum.
- Williams %R: The Williams %R indicator shows oversold conditions, potentially signaling a buying opportunity.
Volatility Analysis:
- Bollinger Bands (BB): The Bollinger Bands have been widening, indicating increased price volatility. The current price is close to the upper band, suggesting a potential overbought condition.
- Bollinger %B: The %B indicator is above 0.5, indicating a bullish momentum in the short term.
Volume Analysis:
- On-Balance Volume (OBV): The OBV has shown a slight increase, indicating accumulation by investors.
- Chaikin Money Flow (CMF): The CMF has been fluctuating around zero, suggesting a balance between buying and selling pressure.
Key Observations:
- The trend indicators show a potential reversal in the short term, supported by the MACD Histogram.
- Momentum indicators suggest a slight bullish bias, with the Stochastic Oscillator showing increasing buying momentum.
- Volatility indicators point to heightened price volatility, with the Bollinger Bands widening.
- Volume indicators indicate a slight accumulation by investors, but the CMF reflects a neutral sentiment.
Conclusion:
Based on the analysis of the technical indicators, the stock price of MLKN is likely to experience a short-term upward movement. The trend indicators hint at a potential reversal, supported by the momentum indicators showing a bullish bias. However, investors should remain cautious due to the increased volatility as indicated by the Bollinger Bands. Overall, a bullish outlook is suggested for the next few days, but close monitoring of price action is recommended to capitalize on potential opportunities and manage risks effectively.