Technical Analysis of MNTK 2024-05-10
Overview:
In analyzing the technical indicators for MNTK over the last 5 days, we will delve into the trend, momentum, volatility, and volume indicators to provide a comprehensive outlook on the possible stock price movement in the coming days. By examining these key aspects, we aim to offer valuable insights and recommendations for potential investors.
Trend Analysis:
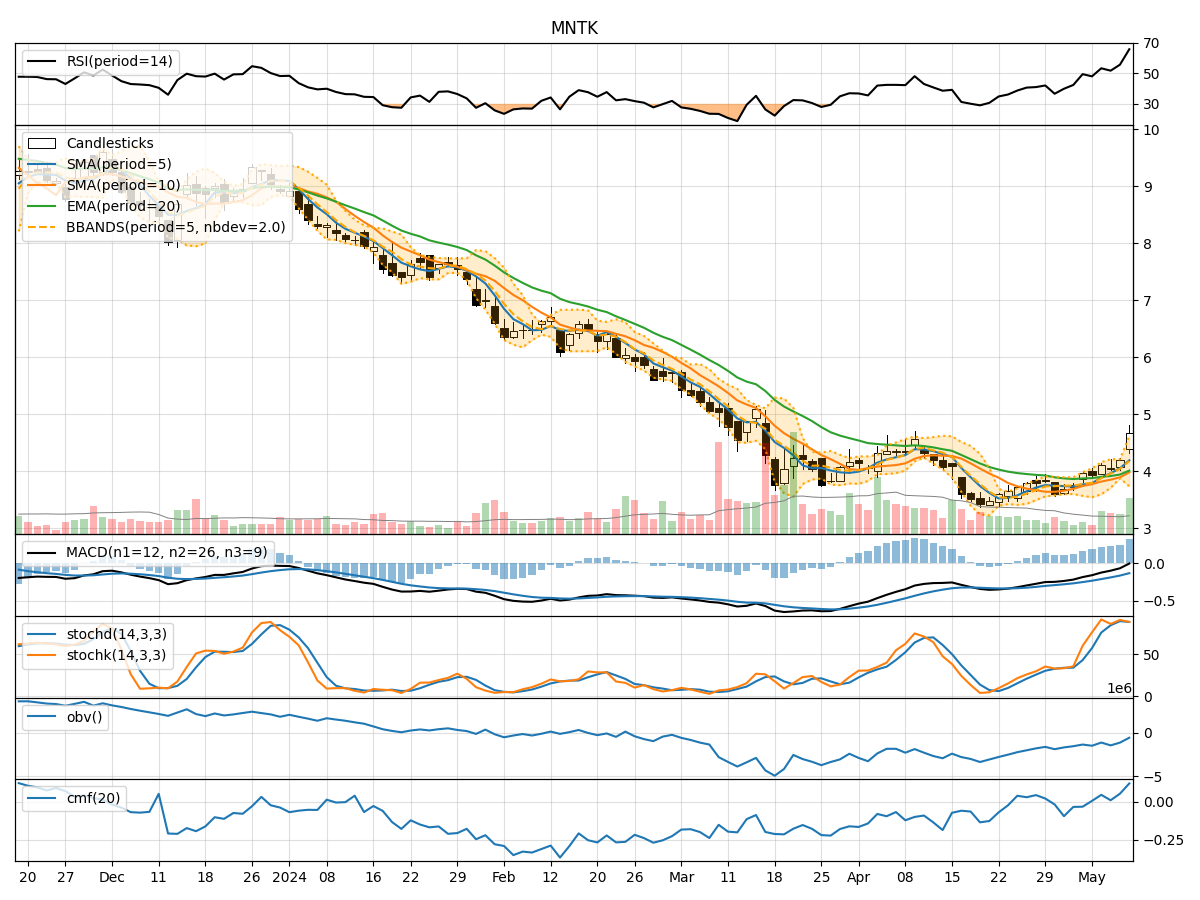
- Moving Averages (MA): The 5-day MA has been consistently above the closing prices, indicating a bullish trend.
- MACD: The MACD line has been negative but trending upwards, suggesting a potential reversal in the bearish momentum.
- RSI: The RSI values have been fluctuating around the neutral zone, indicating a lack of strong trend direction.
Key Observation: The moving averages and MACD signal a potential bullish reversal, while the RSI suggests a neutral stance.
Momentum Analysis:
- Stochastic Oscillator: Both %K and %D values have been fluctuating near the overbought zone, indicating a potential reversal or consolidation.
- Williams %R: The indicator has been hovering around oversold levels, suggesting a possible buying opportunity.
Key Observation: Momentum indicators show mixed signals with a potential for a reversal or consolidation.
Volatility Analysis:
- Bollinger Bands (BB): The stock price has been trading within the bands, indicating normal volatility.
- BB %B: The %B values have been fluctuating within the bands, suggesting no extreme price movements.
Key Observation: Volatility remains stable with no significant deviations from the bands.
Volume Analysis:
- On-Balance Volume (OBV): The OBV values have been fluctuating, indicating indecision among investors.
- Chaikin Money Flow (CMF): The CMF values have been positive, suggesting buying pressure in the market.
Key Observation: Volume indicators reflect mixed sentiment among investors with a slight bias towards buying pressure.
Conclusion:
Based on the analysis of the technical indicators, the next few days' possible stock price movement for MNTK could see sideways consolidation with a slight bullish bias. The trend indicators signal a potential bullish reversal, while momentum indicators show mixed signals with a possibility of consolidation. Volatility remains stable, indicating no major price swings, and volume indicators suggest a slight buying pressure.
In conclusion, the overall outlook for MNTK suggests a sideways consolidation with a slight bullish bias in the coming days. Investors should closely monitor key support and resistance levels for potential entry or exit points.