Technical Analysis of MRCC 2024-05-31
Overview:
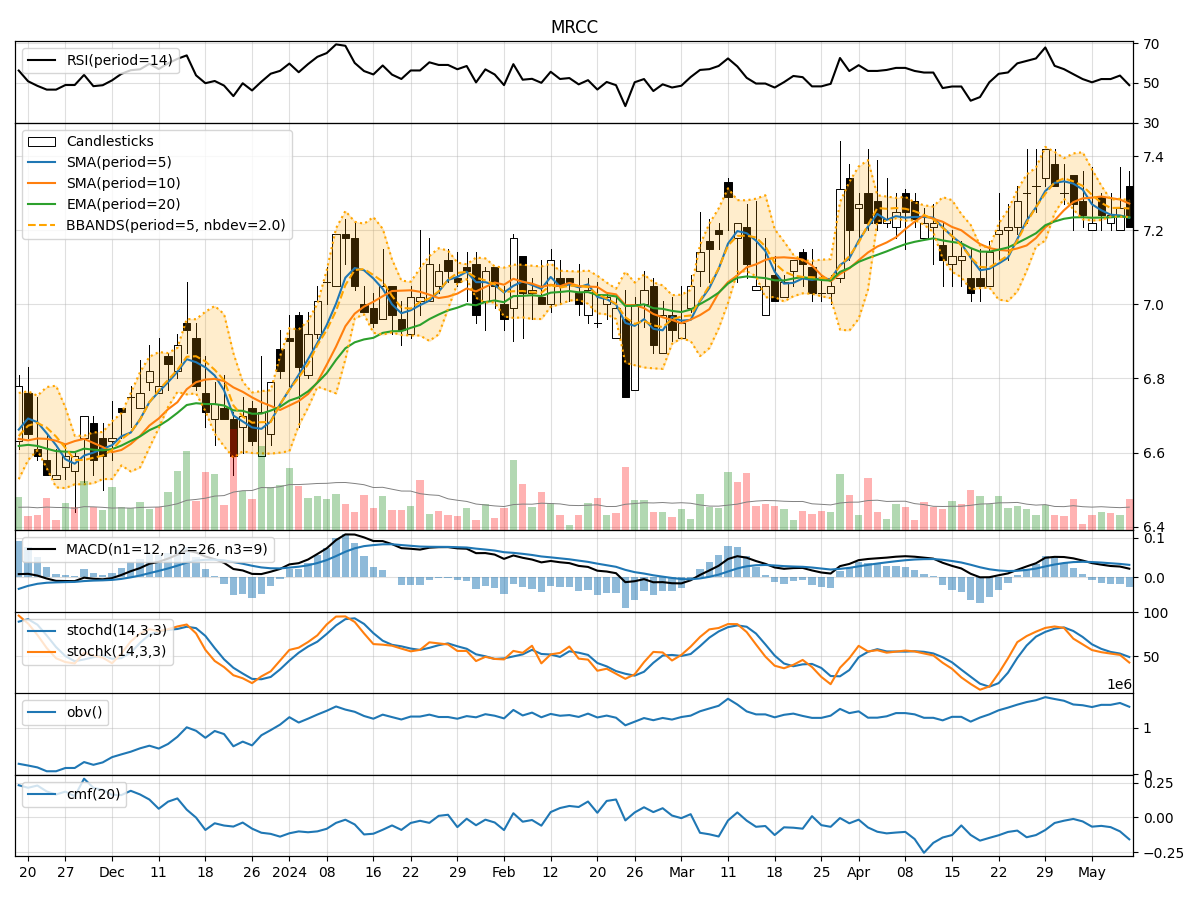
In analyzing the technical indicators for MRCC over the last 5 days, we will delve into the trend, momentum, volatility, and volume indicators to provide a comprehensive outlook on the possible stock price movement in the coming days.
Trend Analysis:
- Moving Averages (MA): The 5-day Moving Average (MA) has been hovering around the closing prices, indicating a relatively stable trend.
- MACD: The Moving Average Convergence Divergence (MACD) has shown positive values, suggesting a bullish momentum in the short term.
- EMA: The Exponential Moving Average (EMA) has been gradually increasing, reflecting a positive trend.
Momentum Analysis:
- RSI: The Relative Strength Index (RSI) has been fluctuating around the mid-level, indicating a neutral momentum.
- Stochastic Oscillator: Both %K and %D have shown mixed signals, with %K crossing %D, suggesting a potential reversal.
- Williams %R: The Williams %R is in the oversold region, indicating a possible buying opportunity.
Volatility Analysis:
- Bollinger Bands (BB): The Bollinger Bands have widened, indicating increased volatility in the stock price.
- BB %B: The %B indicator is fluctuating within the bands, suggesting potential price reversals.
- BB Width: The widening of the bands suggests a potential increase in price volatility.
Volume Analysis:
- On-Balance Volume (OBV): The OBV has shown mixed signals, reflecting indecision among investors.
- Chaikin Money Flow (CMF): The CMF has been negative, indicating selling pressure in the stock.
Key Observations:
- The trend indicators suggest a positive bias in the short term.
- Momentum indicators show a neutral stance with a potential for a bullish reversal.
- Volatility indicators point towards increased price fluctuations.
- Volume indicators reflect mixed sentiments among investors.
Conclusion:
Based on the analysis of the technical indicators, the next few days' possible stock price movement for MRCC is likely to be bullish. The positive trend signals from moving averages and MACD, coupled with the potential reversal indicated by the stochastic oscillator, suggest a favorable outlook. However, the increased volatility and mixed volume signals warrant caution. Traders and investors should closely monitor price movements and key support/resistance levels for timely decision-making.
Recommendation:
Considering the overall technical outlook, it is advisable to consider long positions with proper risk management strategies in place. Traders can look for entry opportunities on pullbacks or trend confirmations. It is essential to stay updated on market developments and adjust trading strategies accordingly to capitalize on potential price movements.