Technical Analysis of MTRX 2024-05-31
Overview:
In analyzing the technical indicators for MTRX over the last 5 days, we will delve into the trends, momentum, volatility, and volume indicators to provide a comprehensive outlook on the possible stock price movement in the coming days.
Trend Analysis:
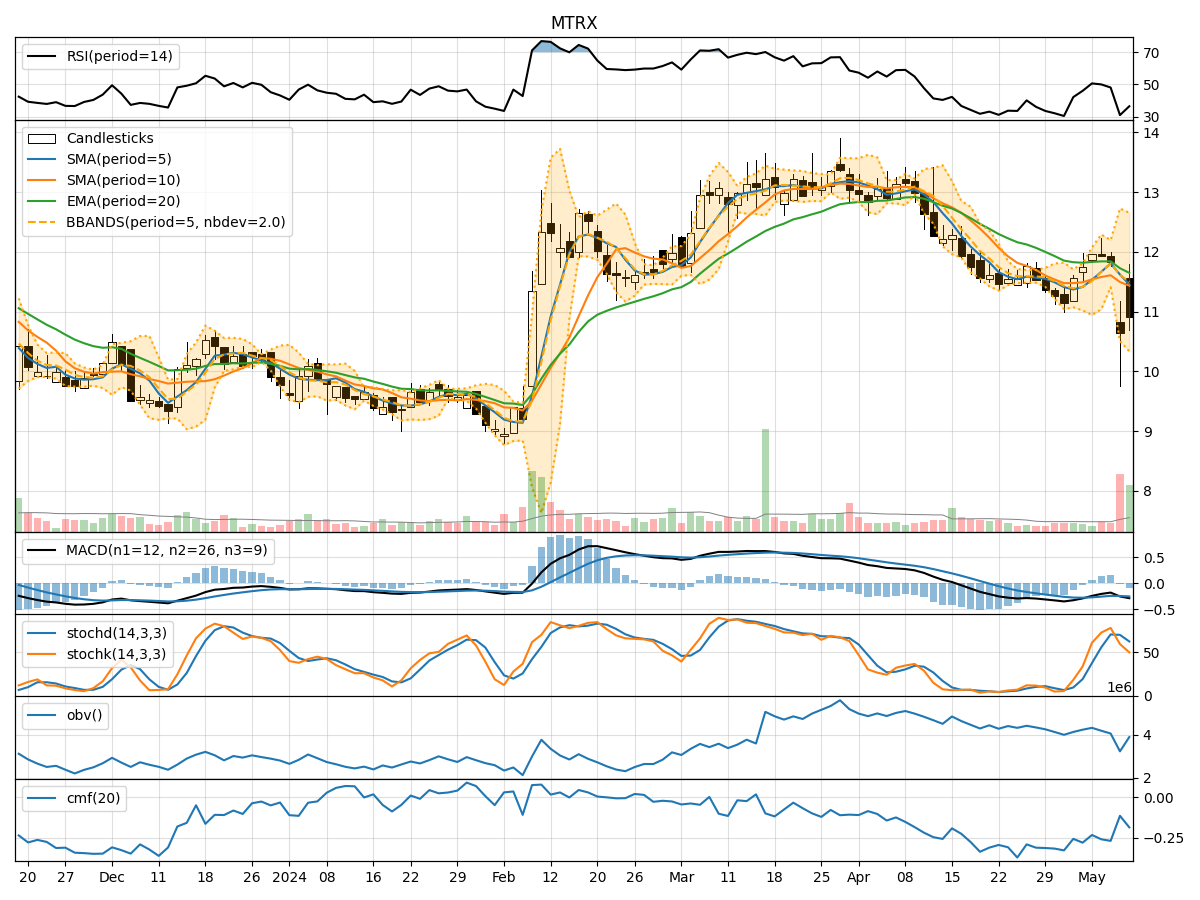
- Moving Averages (MA): The 5-day Moving Average (MA) has been fluctuating around the closing prices, indicating short-term price trends. The Simple Moving Average (SMA) and Exponential Moving Average (EMA) show a slight downward trend, suggesting a potential bearish sentiment.
- Moving Average Convergence Divergence (MACD): The MACD and Signal Line have been negative, indicating a bearish trend in the stock price movement.
Momentum Analysis:
- Relative Strength Index (RSI): The RSI has been fluctuating around the mid-level, indicating a neutral sentiment in the momentum of the stock.
- Stochastic Oscillator: The Stochastic Oscillator shows an upward trend, reaching overbought levels, suggesting a potential reversal or consolidation in the stock price.
Volatility Analysis:
- Bollinger Bands (BB): The Bollinger Bands have widened, indicating increased volatility in the stock price. The bands are currently expanding, suggesting potential price swings in the near future.
Volume Analysis:
- On-Balance Volume (OBV): The OBV has been fluctuating, indicating a balance between buying and selling pressure in the stock.
- Chaikin Money Flow (CMF): The CMF has been negative, indicating a bearish money flow in the stock.
Key Observations:
- The trend indicators suggest a bearish sentiment with the moving averages and MACD showing downward trends.
- Momentum indicators show a neutral to slightly bullish sentiment with the RSI hovering around the mid-level and Stochastic Oscillator reaching overbought levels.
- Volatility indicators indicate increased price swings with the widening Bollinger Bands.
- Volume indicators show a balance between buying and selling pressure with a bearish money flow.
Conclusion:
Based on the analysis of the technical indicators, the stock price of MTRX is likely to experience further downward movement in the coming days. The bearish trend indicated by the moving averages and MACD, coupled with the neutral to slightly bullish momentum and increased volatility, suggests potential price declines. Traders and investors should exercise caution and consider short-term selling strategies or wait for a clearer bullish reversal signal before considering long positions.