Technical Analysis of MU 2024-05-03
Overview:
In analyzing the technical indicators for MU stock over the last 5 days, we will delve into the trend, momentum, volatility, and volume indicators to provide a comprehensive outlook on the possible stock price movement in the coming days. By examining these key indicators, we aim to offer valuable insights and predictions for potential investors.
Trend Analysis:
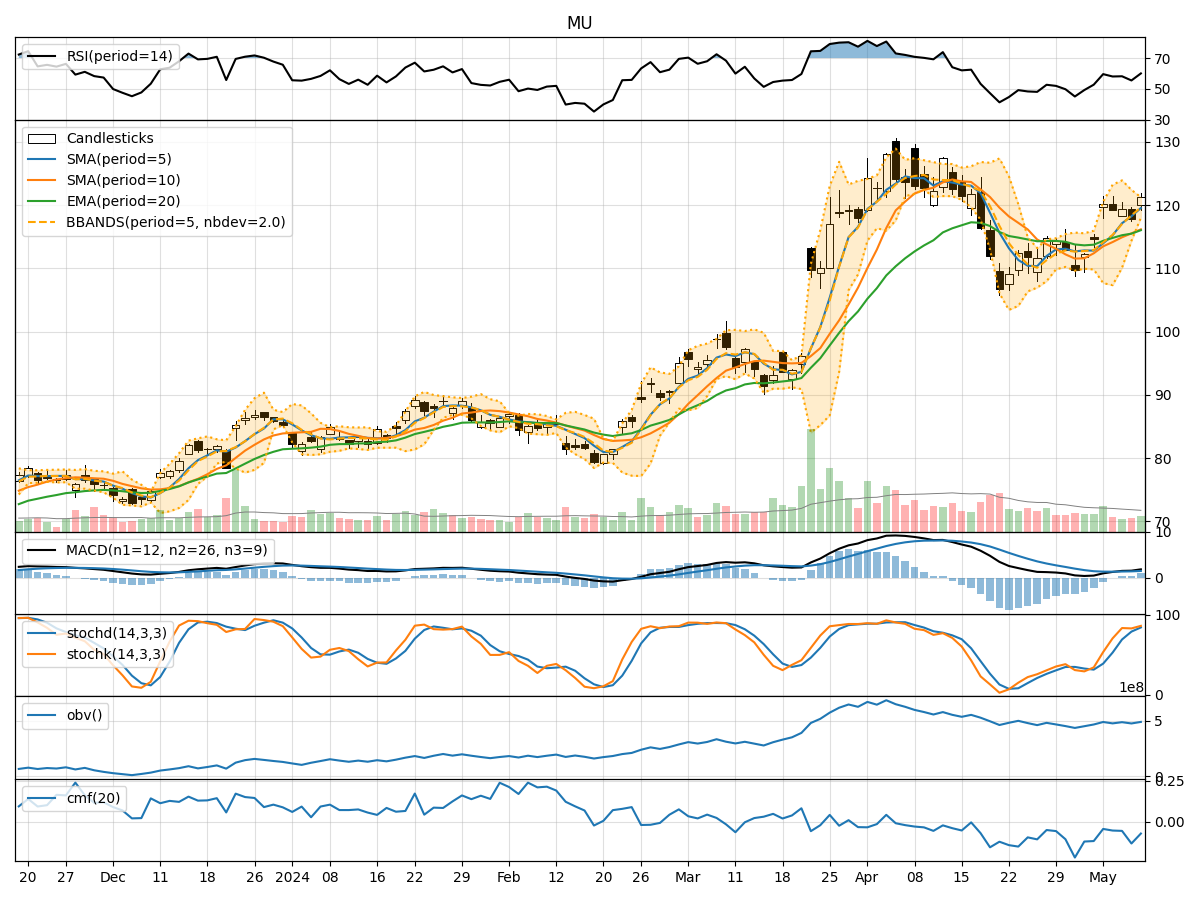
- Moving Averages (MA): The 5-day MA has been fluctuating around the closing prices, indicating short-term price trends. The SMA(10) and EMA(20) show a downward trend, suggesting a bearish sentiment in the medium to long term.
- MACD: The MACD line has been consistently below the signal line, indicating a bearish trend. The MACD histogram has been decreasing, further supporting the bearish sentiment.
Momentum Analysis:
- RSI: The RSI has been hovering around the 50 level, indicating a neutral momentum in the stock.
- Stochastic Oscillator: Both %K and %D lines of the stochastic oscillator have been fluctuating in the oversold region, suggesting a potential reversal in the stock price.
- Williams %R: The Williams %R has been moving towards the oversold territory, indicating a possible buying opportunity.
Volatility Analysis:
- Bollinger Bands: The stock price has been trading within the Bollinger Bands, with the bands narrowing, suggesting a period of consolidation. The %B indicator is around 0.5, indicating a neutral stance.
- Average True Range (ATR): The ATR has been relatively stable, indicating consistent price movements without significant volatility spikes.
Volume Analysis:
- On-Balance Volume (OBV): The OBV has been declining, indicating selling pressure in the stock.
- Chaikin Money Flow (CMF): The CMF has been negative, suggesting outflow of money from the stock.
Conclusion:
Based on the analysis of the technical indicators, the stock is currently in a bearish phase with a potential for a short-term reversal indicated by the stochastic oscillator and Williams %R. However, the overall trend remains bearish due to the downward sloping moving averages and negative momentum indicators like the RSI.
Considering the consolidation indicated by the Bollinger Bands and stable ATR, we may see the stock price trading within a range in the coming days. Investors should exercise caution and wait for more definitive signals before making any significant trading decisions.
In conclusion, the next few days may see the stock price of MU exhibiting sideways movement with a bearish bias unless there is a strong catalyst to reverse the current trend. It is advisable to closely monitor the key technical indicators for any potential shifts in market sentiment.