Technical Analysis of MVIS 2024-05-10
Overview:
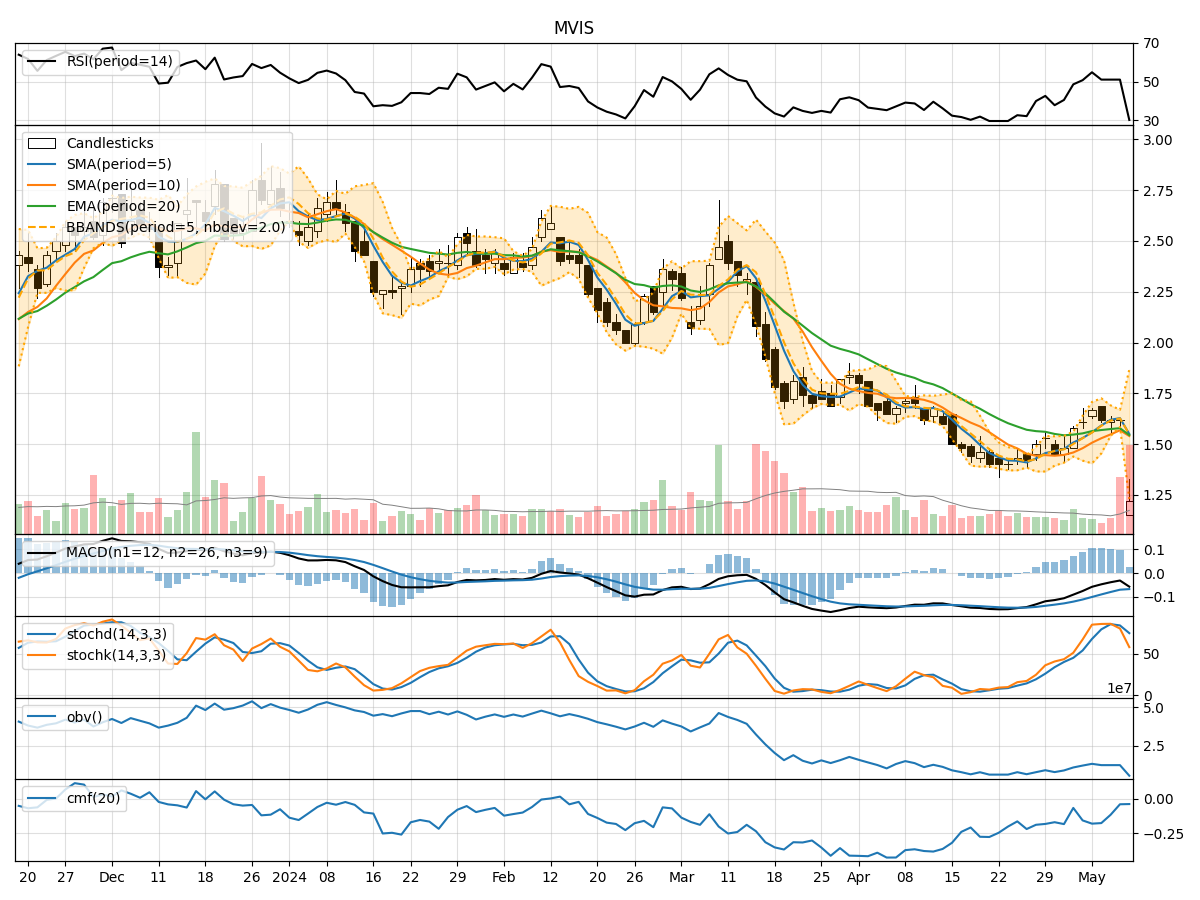
In analyzing the technical indicators for MVIS over the last 5 days, we will delve into the trend, momentum, volatility, and volume indicators to provide a comprehensive outlook on the possible stock price movement in the coming days.
Trend Analysis:
- Moving Averages (MA): The 5-day Moving Average (MA) has been fluctuating around the closing prices, indicating short-term price trends. The Simple Moving Average (SMA) and Exponential Moving Average (EMA) show a slight uptrend.
- MACD: The Moving Average Convergence Divergence (MACD) has been negative, suggesting a bearish momentum in the short term.
- Conclusion: The trend indicators point towards a sideways to slightly bullish trend in the near future.
Momentum Analysis:
- RSI: The Relative Strength Index (RSI) has been fluctuating around the mid-level, indicating a balanced momentum between buying and selling pressure.
- Stochastic Oscillator: The Stochastic indicators show a mix of overbought and oversold conditions, reflecting a lack of clear momentum direction.
- Conclusion: The momentum indicators suggest a neutral stance with no clear bias towards bullish or bearish momentum.
Volatility Analysis:
- Bollinger Bands (BB): The Bollinger Bands have widened, indicating increased volatility in the stock price.
- Conclusion: The volatility indicators signal higher volatility in the upcoming days, which could lead to larger price swings.
Volume Analysis:
- On-Balance Volume (OBV): The OBV has been declining, indicating selling pressure in the stock.
- Chaikin Money Flow (CMF): The CMF has been negative, suggesting a lack of buying interest.
- Conclusion: The volume indicators point towards a bearish sentiment with more selling pressure than buying interest.
Overall Conclusion:
Based on the analysis of trend, momentum, volatility, and volume indicators, the stock price of MVIS is likely to experience a downward movement in the next few days. The trend indicators show a sideways to slightly bullish trend, while the momentum indicators suggest a neutral stance. However, the volatility indicators signal higher volatility, which could lead to larger price swings, and the volume indicators indicate a bearish sentiment with more selling pressure.
Recommendation:
Considering the overall analysis, it is advisable to exercise caution in trading MVIS in the coming days. Traders should closely monitor the price movements and consider setting stop-loss orders to manage risks effectively. Long-term investors may find better entry points after a potential price correction.