Technical Analysis of NFLX 2024-05-03
Overview:
In analyzing the technical indicators for NFLX over the last 5 days, we will delve into the trend, momentum, volatility, and volume indicators to provide a comprehensive outlook on the possible stock price movement. By examining these key factors, we aim to offer valuable insights and predictions for the upcoming days.
Trend Indicators:
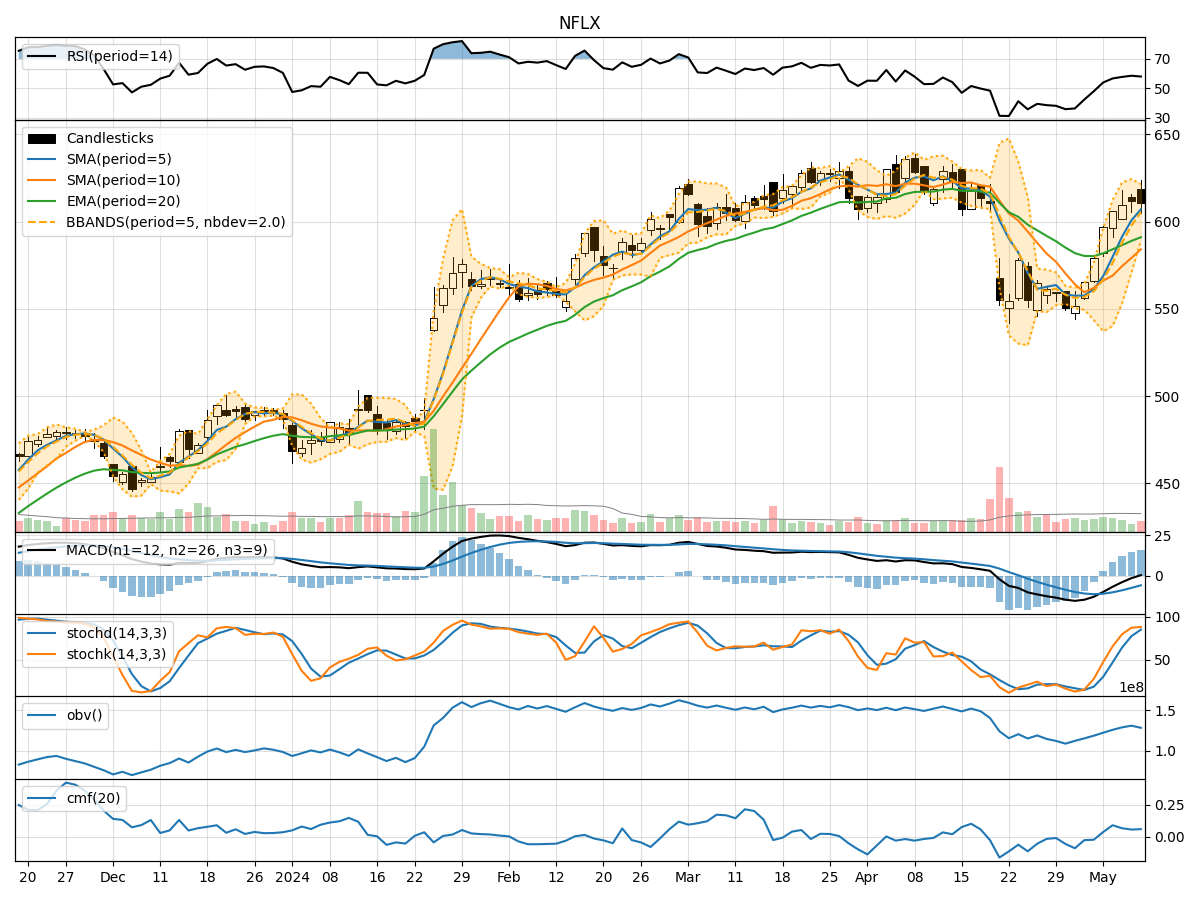
- Moving Averages (MA): The 5-day MA has been consistently below the 10-day SMA and 20-day EMA, indicating a short-term bearish trend.
- MACD: The MACD line has been below the signal line, with negative values for MACD histogram, suggesting a bearish momentum.
Momentum Indicators:
- RSI: The RSI has been relatively low, indicating oversold conditions in the market.
- Stochastic Oscillator: Both %K and %D have been trending lower, signaling a bearish momentum.
Volatility Indicators:
- Bollinger Bands (BB): The stock price has been trading within the lower Bollinger Band, suggesting a potential oversold condition.
Volume Indicators:
- On-Balance Volume (OBV): The OBV has been declining, indicating selling pressure in the market.
- Chaikin Money Flow (CMF): The CMF has been negative, reflecting a lack of buying interest.
Key Observations:
- The trend indicators show a bearish sentiment with moving averages and MACD signaling a downward trend.
- Momentum indicators like RSI and Stochastic Oscillator indicate oversold conditions, potentially leading to a reversal.
- Volatility indicators suggest the stock is near oversold levels based on Bollinger Bands.
- Volume indicators reflect selling pressure with declining OBV and negative CMF.
Conclusion:
Based on the analysis of technical indicators, the next few days for NFLX are likely to see further downward movement in the stock price. The bearish trend indicated by moving averages and MACD, coupled with oversold conditions highlighted by momentum indicators, suggest a continuation of the current downward trajectory. Traders and investors should exercise caution and consider waiting for signs of a reversal before considering long positions.