Technical Analysis of NMRA 2024-05-10
Overview:
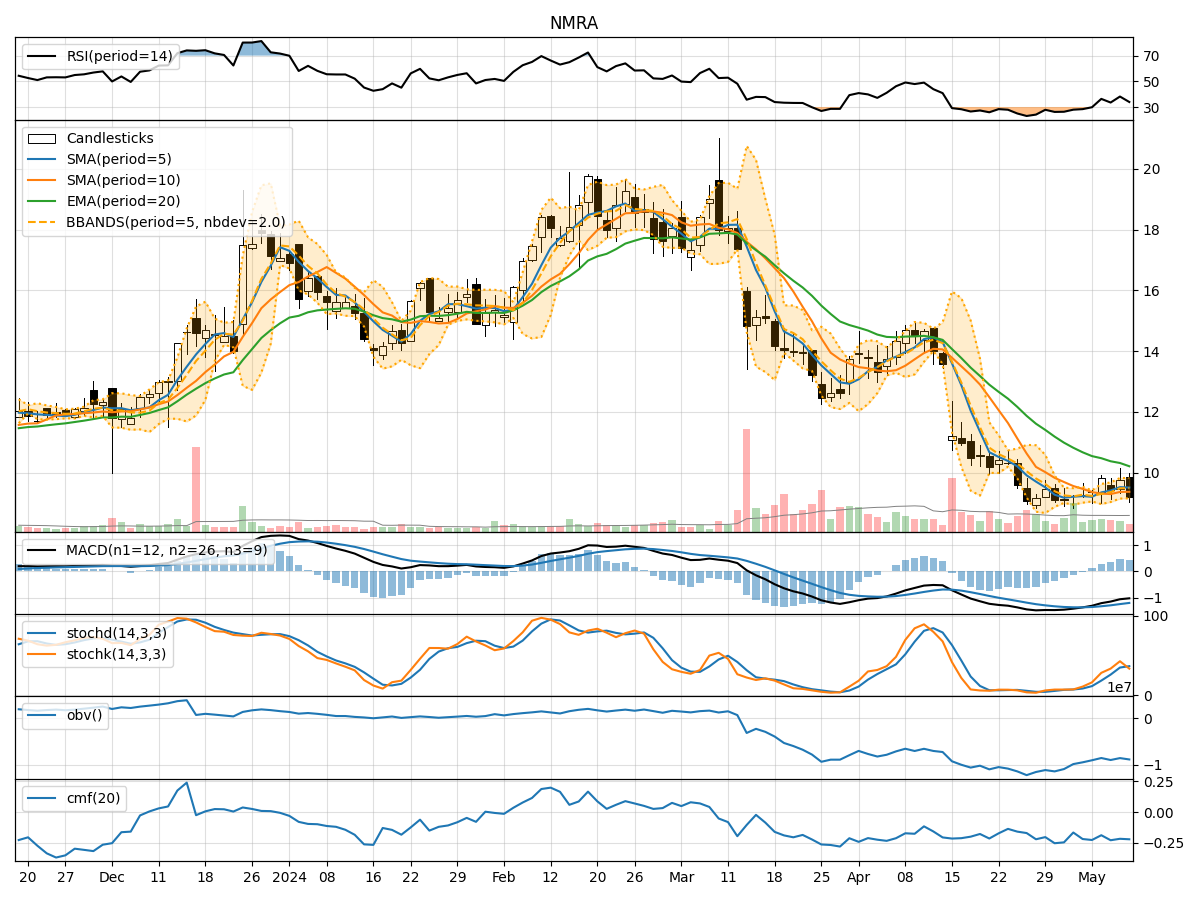
In analyzing the technical indicators for NMRA over the last 5 days, we will delve into the trend, momentum, volatility, and volume indicators to provide a comprehensive outlook on the possible stock price movement in the coming days.
Trend Analysis:
- Moving Averages (MA): The 5-day Moving Average (MA) has been fluctuating around the closing prices, indicating short-term price trends. The Simple Moving Average (SMA) and Exponential Moving Average (EMA) show a downward trend, suggesting a bearish sentiment.
- MACD: The Moving Average Convergence Divergence (MACD) has been negative, with the MACD line consistently below the signal line. This indicates a bearish trend in the stock price.
Momentum Analysis:
- RSI: The Relative Strength Index (RSI) has been below 50, indicating a bearish momentum in the stock. The RSI has not shown any signs of significant recovery.
- Stochastic Oscillator: Both %K and %D have been below 50, suggesting a bearish momentum in the stock price. The stock is not in the oversold region yet, indicating potential further downside.
Volatility Analysis:
- Bollinger Bands (BB): The Bollinger Bands have been narrowing, indicating decreasing volatility in the stock price. The bands are currently close to each other, suggesting a period of consolidation.
- Bollinger %B: The %B indicator is below 1, indicating that the stock price is trading below the lower Bollinger Band. This could signal an oversold condition.
Volume Analysis:
- On-Balance Volume (OBV): The OBV has been negative, indicating a net selling pressure in the stock. This aligns with the bearish sentiment observed in other indicators.
- Chaikin Money Flow (CMF): The CMF has been negative, indicating that money is flowing out of the stock. This further supports the bearish outlook.
Conclusion:
Based on the analysis of the technical indicators, the overall outlook for NMRA in the next few days is bearish. The trend indicators, momentum indicators, and volume indicators all point towards a continuation of the downward trend in the stock price. The volatility indicators suggest a period of consolidation or potential oversold conditions. Therefore, investors should exercise caution and consider waiting for more positive signals before considering any long positions.