Technical Analysis of NVDA 2024-05-10
Overview:
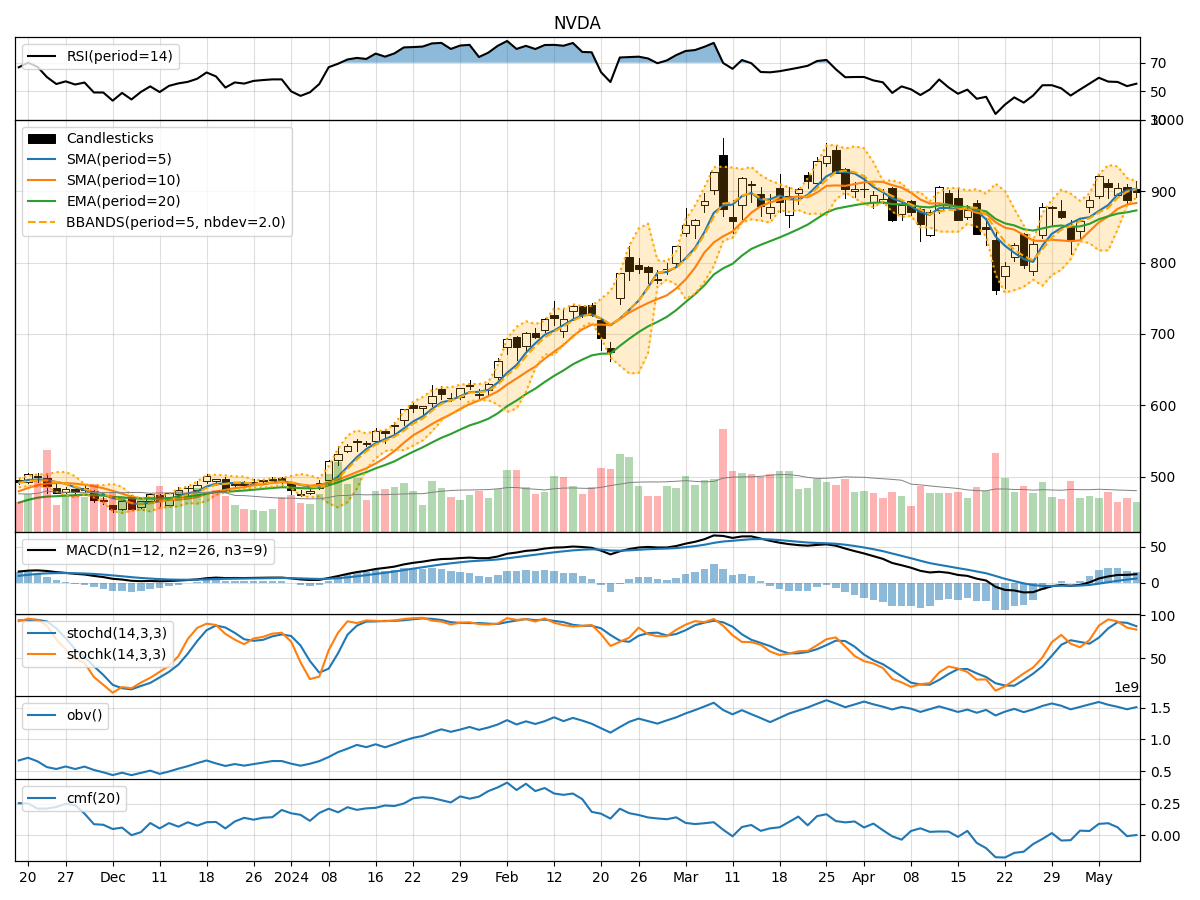
In the last 5 trading days, NVDA has shown some fluctuations in its stock price, with a mix of bullish and bearish signals across various technical indicators. By analyzing trend, momentum, volatility, and volume indicators, we can gain insights into the possible future price movement of NVDA.
Trend Indicators:
- Moving Averages (MA): The 5-day MA has been consistently above the 10-day SMA, indicating a short-term bullish trend. The EMA(20) has been showing an upward trend, suggesting positive momentum.
- MACD: The MACD line has been above the signal line for the past few days, indicating bullish momentum.
- Conclusion: The trend indicators suggest that NVDA is currently in an upward trend.
Momentum Indicators:
- RSI: The RSI has been fluctuating around the neutral zone, indicating indecision in the market.
- Stochastic Oscillator: Both %K and %D have been declining, showing a potential bearish signal.
- Williams %R: The Williams %R is in the oversold territory, suggesting a possible reversal.
- Conclusion: The momentum indicators are mixed, with a slight bearish bias.
Volatility Indicators:
- Bollinger Bands: The stock price has been trading within the bands, indicating normal volatility.
- Conclusion: Volatility is relatively stable, with no significant outliers.
Volume Indicators:
- On-Balance Volume (OBV): The OBV has been fluctuating, indicating mixed buying and selling pressure.
- Chaikin Money Flow (CMF): The CMF has been positive but decreasing, suggesting weakening buying pressure.
- Conclusion: Volume indicators show a neutral stance with no clear direction.
Overall Conclusion:
Based on the analysis of technical indicators, NVDA is currently in an upward trend with bullish momentum. However, the mixed signals from momentum and volume indicators suggest a potential short-term consolidation or pullback in the stock price. Traders should exercise caution and wait for more clarity in market direction before making significant trading decisions.
Recommendation:
- Short-Term: Expect a possible consolidation or pullback in the stock price.
- Long-Term: The overall trend remains bullish, so investors can consider holding their positions with a close eye on key support levels.
Always remember to monitor the market closely and consider using stop-loss orders to manage risk effectively. It's essential to combine technical analysis with fundamental research for a comprehensive understanding of the stock's potential movements.