Technical Analysis of OKTA 2024-05-10
Overview:
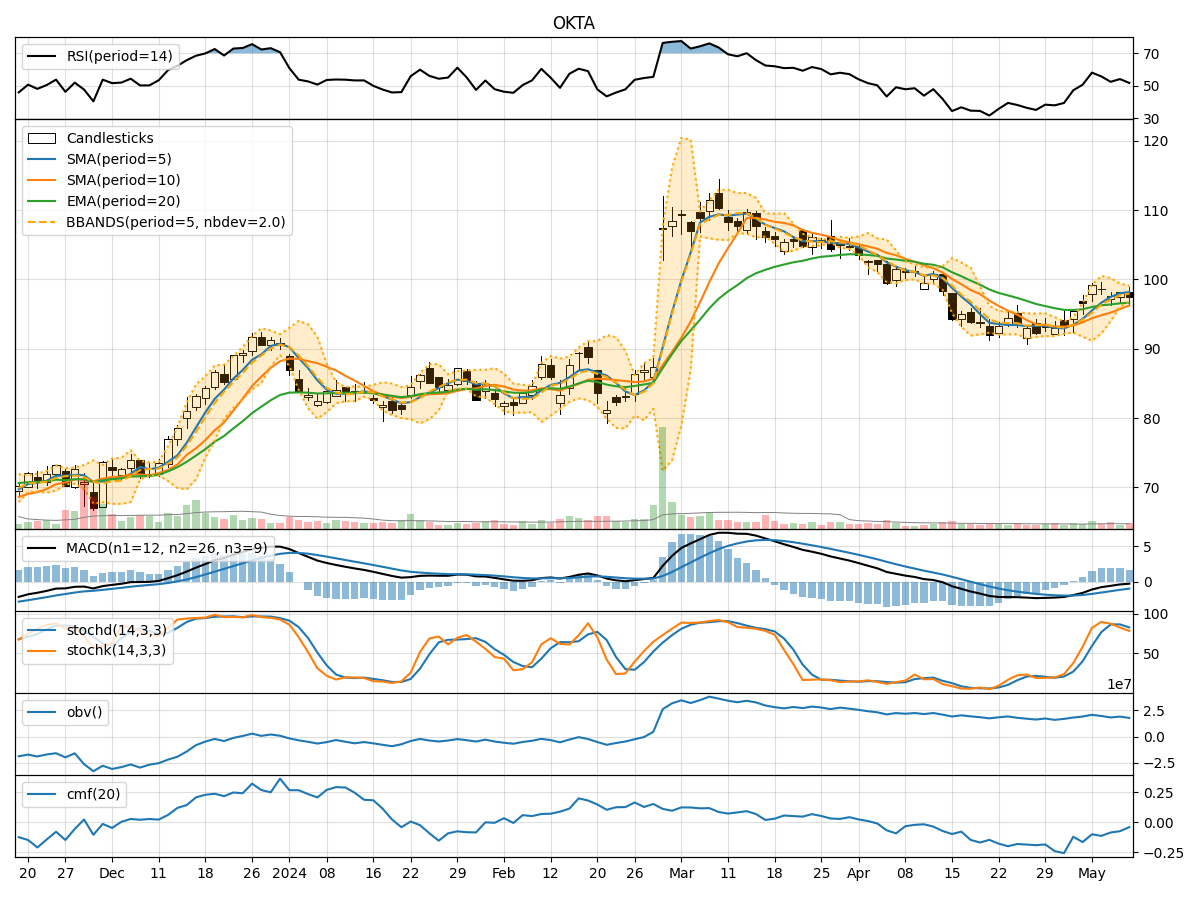
In analyzing the technical indicators for OKTA over the last 5 days, we will delve into the trend, momentum, volatility, and volume indicators to provide a comprehensive outlook on the possible stock price movement in the coming days. By examining these key aspects, we aim to offer valuable insights and predictions for informed decision-making.
Trend Analysis:
- Moving Averages (MA): The 5-day Moving Average (MA) has been consistently above the Simple Moving Average (SMA) and Exponential Moving Average (EMA), indicating a bullish trend.
- MACD: The MACD line has been negative but trending upwards, while the MACD Histogram has shown an increasing trend, suggesting a potential bullish reversal.
Momentum Analysis:
- RSI: The Relative Strength Index (RSI) has been fluctuating around the neutral zone, indicating indecision in the market.
- Stochastic Oscillator: Both %K and %D have been declining, signaling a bearish momentum.
Volatility Analysis:
- Bollinger Bands (BB): The stock price has been trading within the Bollinger Bands, with the bands narrowing, indicating decreasing volatility.
Volume Analysis:
- On-Balance Volume (OBV): The OBV has been declining, suggesting selling pressure in the market.
- Chaikin Money Flow (CMF): The CMF has been negative, indicating a bearish money flow trend.
Key Observations:
- The trend indicators suggest a potential bullish reversal with the MACD showing positive momentum.
- Momentum indicators reflect a bearish sentiment with the Stochastic Oscillator pointing towards a downward trend.
- Volatility has been decreasing, indicating a possible period of consolidation.
- Volume indicators show selling pressure with a negative OBV and CMF.
Conclusion:
Based on the analysis of the technical indicators, the next few days for OKTA stock price movement are likely to be sideways with a slight bullish bias. While the trend indicators hint at a potential bullish reversal, the momentum and volume indicators suggest a bearish sentiment in the market. The decreasing volatility may lead to a period of consolidation before a clear direction is established. Traders should exercise caution and closely monitor key levels for potential entry or exit points.
Recommendation:
- Short-term Traders: Consider waiting for confirmation of a bullish trend reversal before entering long positions.
- Long-term Investors: Monitor the stock closely for signs of a sustained uptrend before increasing exposure.
- Risk Management: Implement stop-loss orders to protect against unexpected downside movements.
By combining insights from trend, momentum, volatility, and volume indicators, investors can make well-informed decisions aligned with the current market dynamics.