Technical Analysis of OMER 2024-05-31
Overview:
In analyzing the technical indicators for OMER over the last 5 days, we will delve into the trend, momentum, volatility, and volume indicators to provide a comprehensive outlook on the possible stock price movement in the coming days.
Trend Analysis:
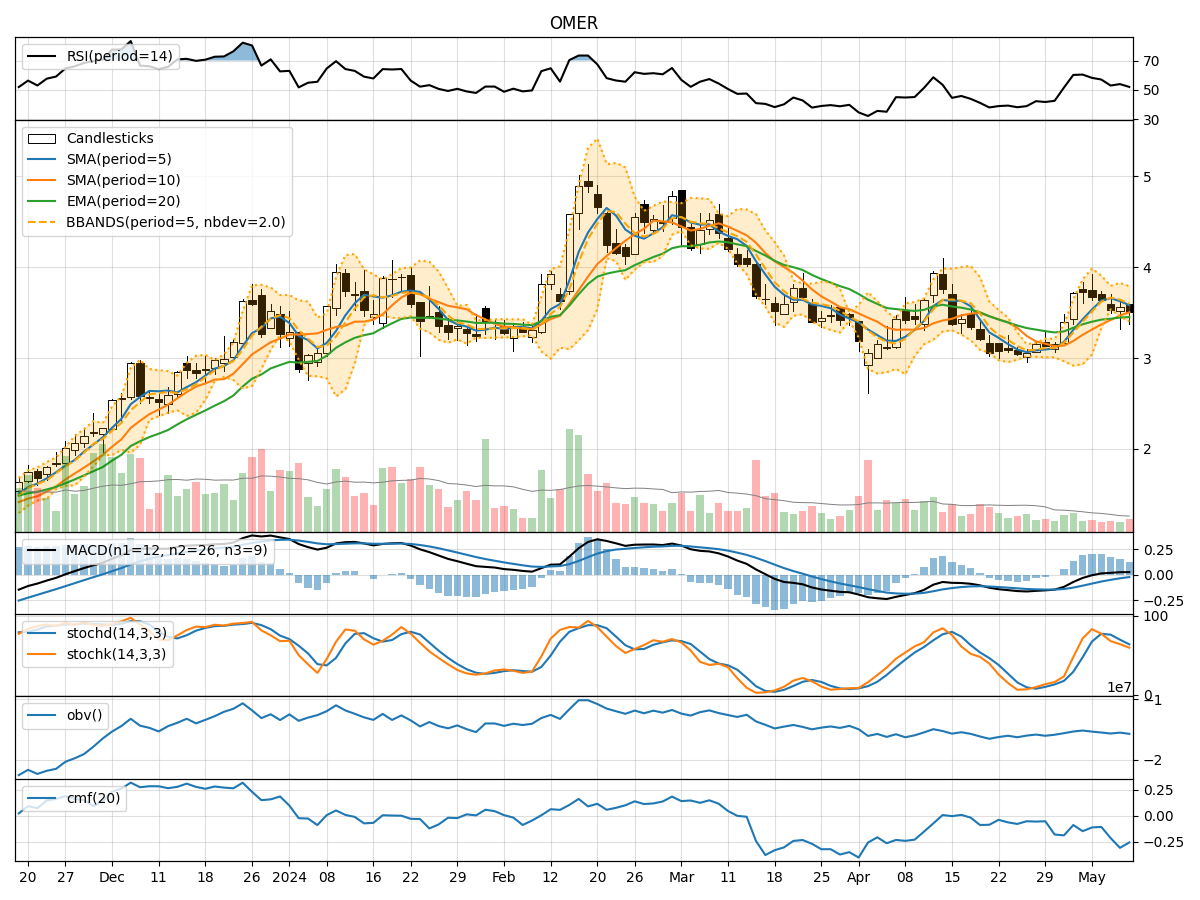
- Moving Averages (MA): The 5-day Moving Average (MA) has been declining, indicating a short-term bearish trend.
- MACD: The MACD line has been consistently negative, suggesting a bearish momentum in the stock.
- EMA: The Exponential Moving Average (EMA) has also been decreasing, aligning with the bearish sentiment in the short term.
Momentum Analysis:
- RSI: The Relative Strength Index (RSI) has been hovering around the mid-level, indicating a neutral momentum.
- Stochastic Oscillator: Both %K and %D have been in the oversold territory, signaling a potential reversal or consolidation.
- Williams %R: The Williams %R is in the oversold region, suggesting a possible buying opportunity.
Volatility Analysis:
- Bollinger Bands (BB): The Bollinger Bands have been narrowing, indicating decreasing volatility in the stock.
- BB %B: The %B indicator is below 0.5, suggesting a potential oversold condition.
- BB Width: The narrowing of the Bollinger Bands width indicates a period of consolidation or a potential breakout.
Volume Analysis:
- On-Balance Volume (OBV): The OBV has been declining, indicating selling pressure in the stock.
- Chaikin Money Flow (CMF): The CMF has been decreasing, reflecting a bearish money flow trend.
Conclusion:
Based on the analysis of the technical indicators, the stock of OMER is currently in a bearish phase with a downward trend in moving averages, negative MACD, and declining EMA. The momentum indicators suggest a neutral to oversold condition, potentially hinting at a consolidation or reversal in the near future. The volatility indicators point towards decreasing volatility and a possible period of consolidation. The volume indicators indicate selling pressure and a bearish money flow trend.
Forecast:
Considering the overall bearish sentiment in the technical indicators, the next few days for OMER are likely to see further downside movement in the stock price. Traders and investors should exercise caution and consider waiting for clearer signals of a trend reversal before considering long positions.