Technical Analysis of PFIS 2024-05-31
Overview:
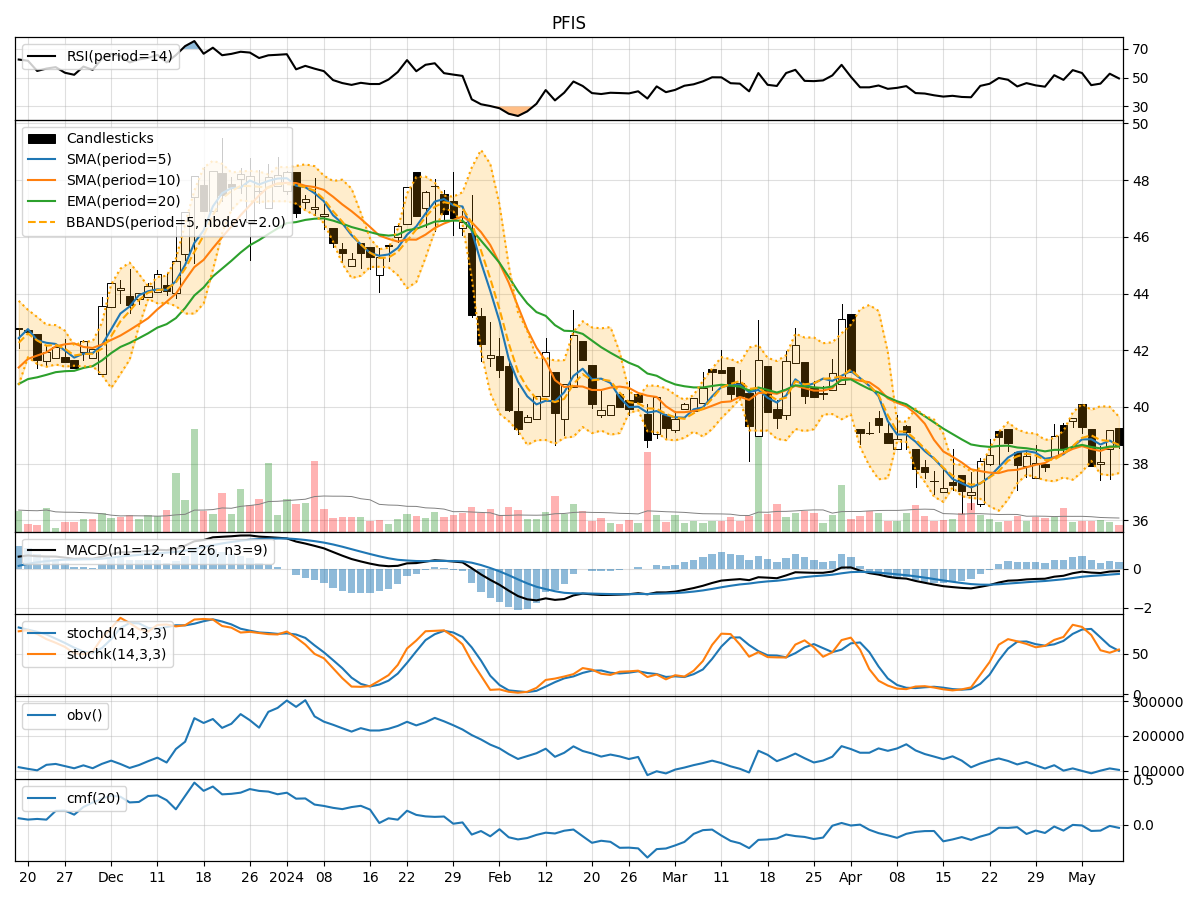
In analyzing the technical indicators for PFIS over the last 5 days, we will delve into the trend, momentum, volatility, and volume indicators to provide a comprehensive outlook on the possible stock price movement in the coming days. By examining these key indicators, we aim to offer valuable insights and predictions to guide your investment decisions.
Trend Analysis:
- Moving Averages (MA): The 5-day Moving Average (MA) has been fluctuating around the closing prices, indicating short-term price trends. The Simple Moving Average (SMA) and Exponential Moving Average (EMA) show a slight upward trend, suggesting potential bullish momentum.
- MACD: The Moving Average Convergence Divergence (MACD) and its signal line have been positive, indicating a bullish trend. The MACD Histogram has been decreasing but remains above the zero line, signaling a potential slowdown in bullish momentum.
Momentum Analysis:
- RSI: The Relative Strength Index (RSI) has been fluctuating in the neutral zone, indicating indecision in the market. It has not reached overbought or oversold levels, suggesting a lack of strong momentum in either direction.
- Stochastic Oscillator: Both %K and %D lines of the Stochastic Oscillator have been declining, moving towards oversold territory. This indicates a potential bearish momentum in the short term.
Volatility Analysis:
- Bollinger Bands (BB): The Bollinger Bands have been narrowing, indicating decreasing volatility. The bands are currently close to the price, suggesting a potential breakout or significant price movement in the near future.
- Bollinger %B: The %B indicator has been hovering around 0.5, indicating a neutral position. This suggests that the stock price is neither overbought nor oversold based on Bollinger Bands.
Volume Analysis:
- On-Balance Volume (OBV): The OBV has been fluctuating, indicating mixed buying and selling pressure. The overall trend in OBV has been slightly negative, suggesting some distribution of shares.
- Chaikin Money Flow (CMF): The CMF has been negative, indicating that money may be flowing out of the stock. This suggests a bearish sentiment in terms of volume flow.
Conclusion:
Based on the analysis of the technical indicators, the stock price of PFIS is likely to experience a short-term downward movement. The trend indicators show a potential bullish bias, but the momentum indicators suggest a bearish sentiment in the near future. The narrowing Bollinger Bands and negative volume indicators further support the likelihood of a downward price movement.
Key Conclusion: The overall outlook for PFIS in the next few days leans towards a bearish trend, with the possibility of a price decline. Investors should exercise caution and consider potential short-term selling opportunities or implementing risk management strategies to navigate the expected downward movement.