Technical Analysis of PPSI 2024-05-31
Overview:
In analyzing the technical indicators for PPSI over the last 5 days, we will delve into the trend, momentum, volatility, and volume indicators to provide a comprehensive outlook on the possible stock price movement in the coming days. By examining these key aspects, we aim to offer valuable insights and predictions for potential investors.
Trend Analysis:
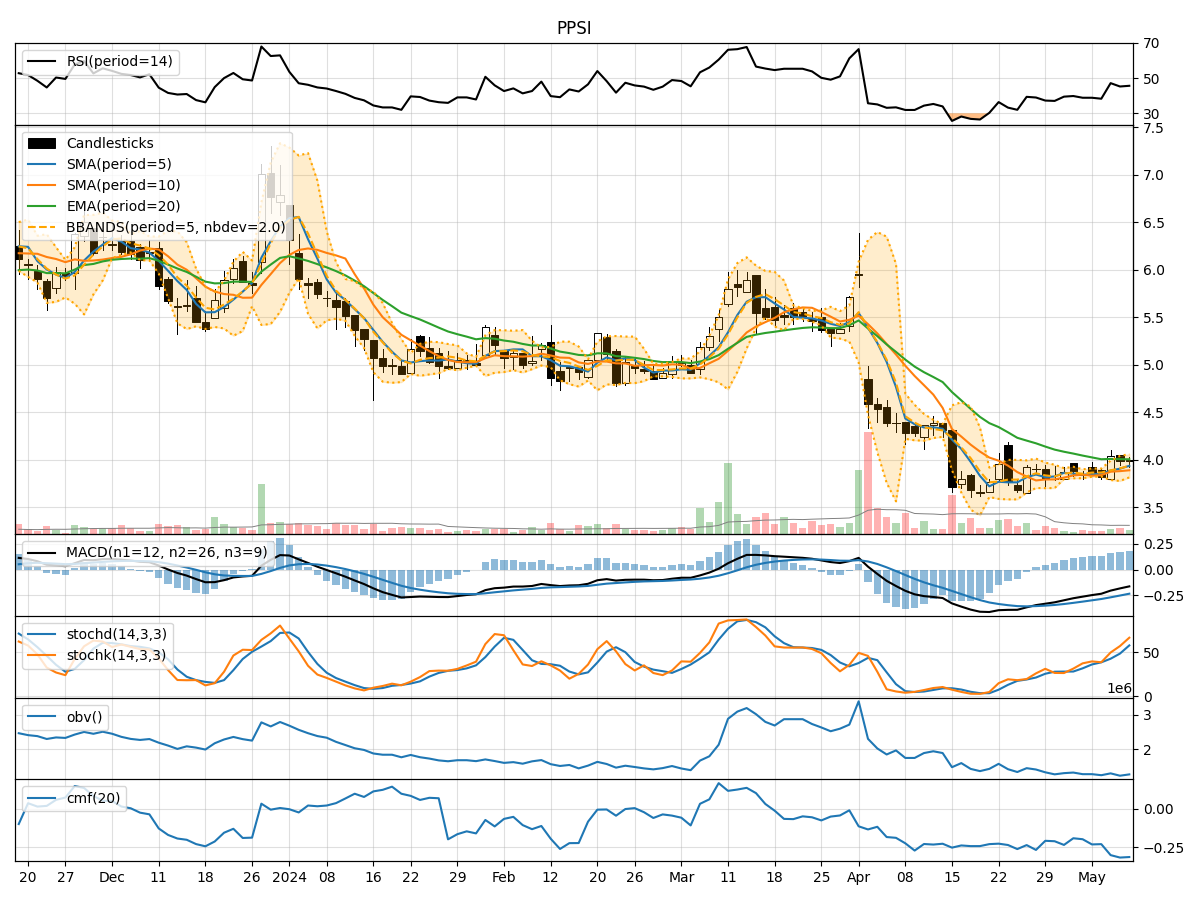
- Moving Averages (MA): The 5-day MA has been fluctuating around the closing prices, indicating short-term price trends. The SMA(10) and EMA(20) have shown a slight downward trend, suggesting a weakening momentum.
- MACD: The MACD line has been consistently below the signal line, indicating a bearish trend. The MACD histogram has been decreasing, signaling a potential continuation of the downward movement.
Momentum Analysis:
- RSI: The RSI has been fluctuating around the 50 level, indicating a lack of strong momentum in either direction.
- Stochastic Oscillator: Both %K and %D have shown mixed signals, with %K crossing %D multiple times, suggesting indecision in the market.
- Williams %R: The Williams %R has been in oversold territory, indicating a potential reversal in the short term.
Volatility Analysis:
- Bollinger Bands: The stock price has been trading within the bands, with the bands narrowing, indicating decreasing volatility.
- Bollinger %B: The %B has been decreasing, suggesting a potential consolidation phase.
Volume Analysis:
- On-Balance Volume (OBV): The OBV has been negative, indicating selling pressure in the market.
- Chaikin Money Flow (CMF): The CMF has been negative, suggesting outflow of money from the stock.
Key Observations:
- The trend indicators show a bearish sentiment with a weakening momentum.
- Volatility is decreasing, indicating a potential consolidation phase.
- Volume indicators suggest selling pressure and outflow of money from the stock.
Conclusion:
Based on the analysis of the technical indicators, the stock is likely to experience further downward movement in the coming days. The bearish trend, coupled with weakening momentum and negative volume indicators, suggests a potential continuation of the current downtrend. Investors should exercise caution and consider waiting for a more favorable entry point before considering any long positions.