Technical Analysis of PRAA 2024-05-31
Overview:
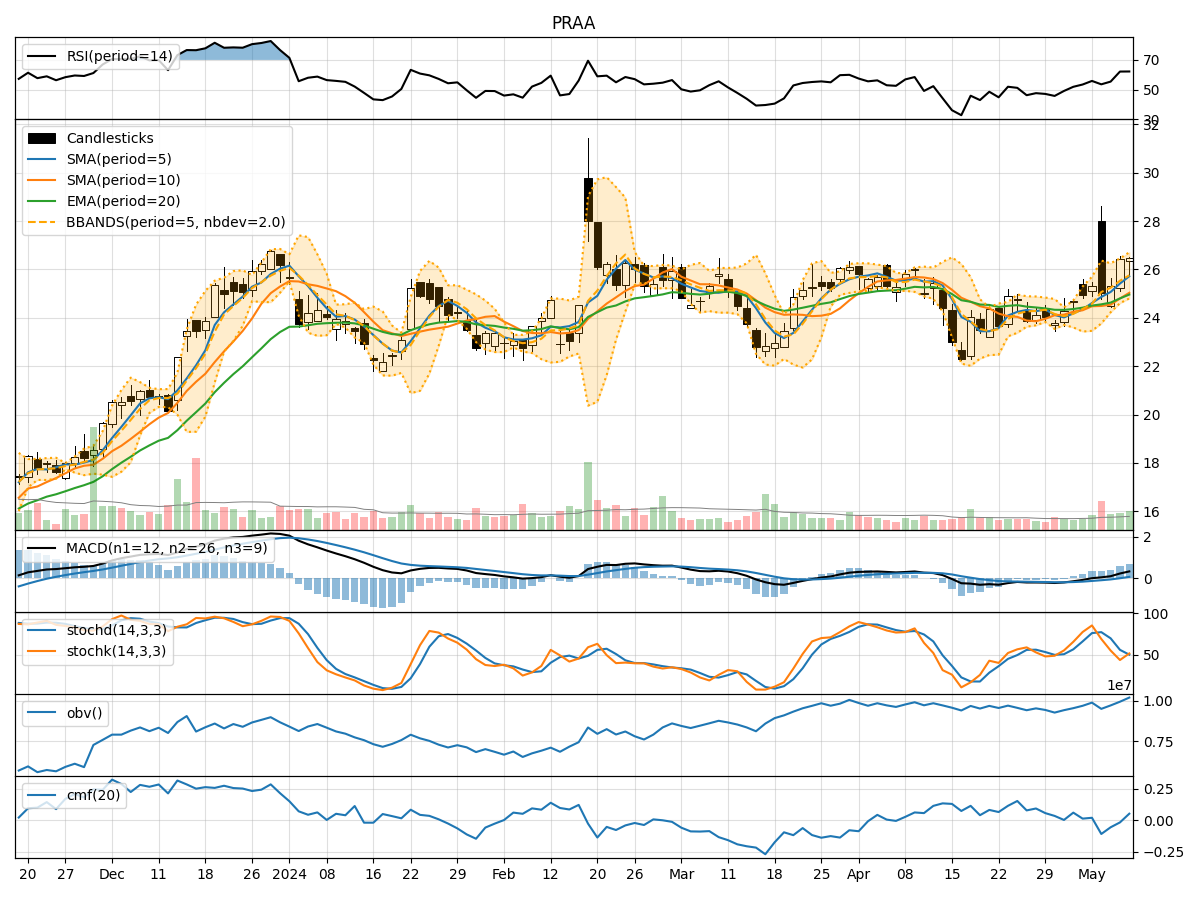
In analyzing the technical indicators for PRAA over the last 5 days, we will delve into the trend, momentum, volatility, and volume indicators to provide a comprehensive outlook on the possible stock price movement in the coming days. By examining these key indicators, we aim to offer valuable insights and recommendations for potential investors.
Trend Analysis:
- Moving Averages (MA): The 5-day MA has been consistently below the closing prices, indicating a short-term downtrend.
- MACD: The MACD line has been decreasing, with the MACD line crossing below the signal line, suggesting a bearish momentum.
- EMA: The EMA has been declining, further supporting the bearish trend.
Momentum Analysis:
- RSI: The RSI has been hovering around the oversold territory, indicating a potential reversal or continuation of the downtrend.
- Stochastic Oscillator: Both %K and %D have been relatively low, signaling potential oversold conditions.
- Williams %R: The indicator has been consistently in the oversold region, suggesting a bearish sentiment.
Volatility Analysis:
- Bollinger Bands (BB): The stock price has been trading below the middle Bollinger Band, indicating a bearish trend.
- Bollinger Band Width (BBW): The BBW has been relatively narrow, suggesting low volatility.
- Bollinger Band %B (BBP): The %B has been below 0.5, indicating a bearish sentiment.
Volume Analysis:
- On-Balance Volume (OBV): The OBV has been declining, reflecting selling pressure in the stock.
- Chaikin Money Flow (CMF): The CMF has been negative, indicating a bearish money flow trend.
Key Observations and Opinions:
- The technical indicators collectively suggest a bearish outlook for PRAA in the near term.
- The stock is currently in a downtrend, supported by the moving averages and MACD.
- Momentum indicators like RSI and Stochastic Oscillator point towards oversold conditions, potentially signaling a reversal.
- Volatility remains low, indicating a lack of significant price movements.
- Volume indicators reflect a negative sentiment with declining OBV and CMF.
Conclusion:
Based on the analysis of the technical indicators, the next few days for PRAA are likely to see a continuation of the bearish trend. Investors should exercise caution and consider waiting for signs of a potential reversal before considering any long positions. The stock is currently in a downtrend with oversold conditions, suggesting a possible bounce-back, but overall sentiment remains bearish. It is advisable to closely monitor key support levels and wait for confirmation of a trend reversal before considering any bullish positions.