Technical Analysis of PUBM 2024-05-10
Overview:
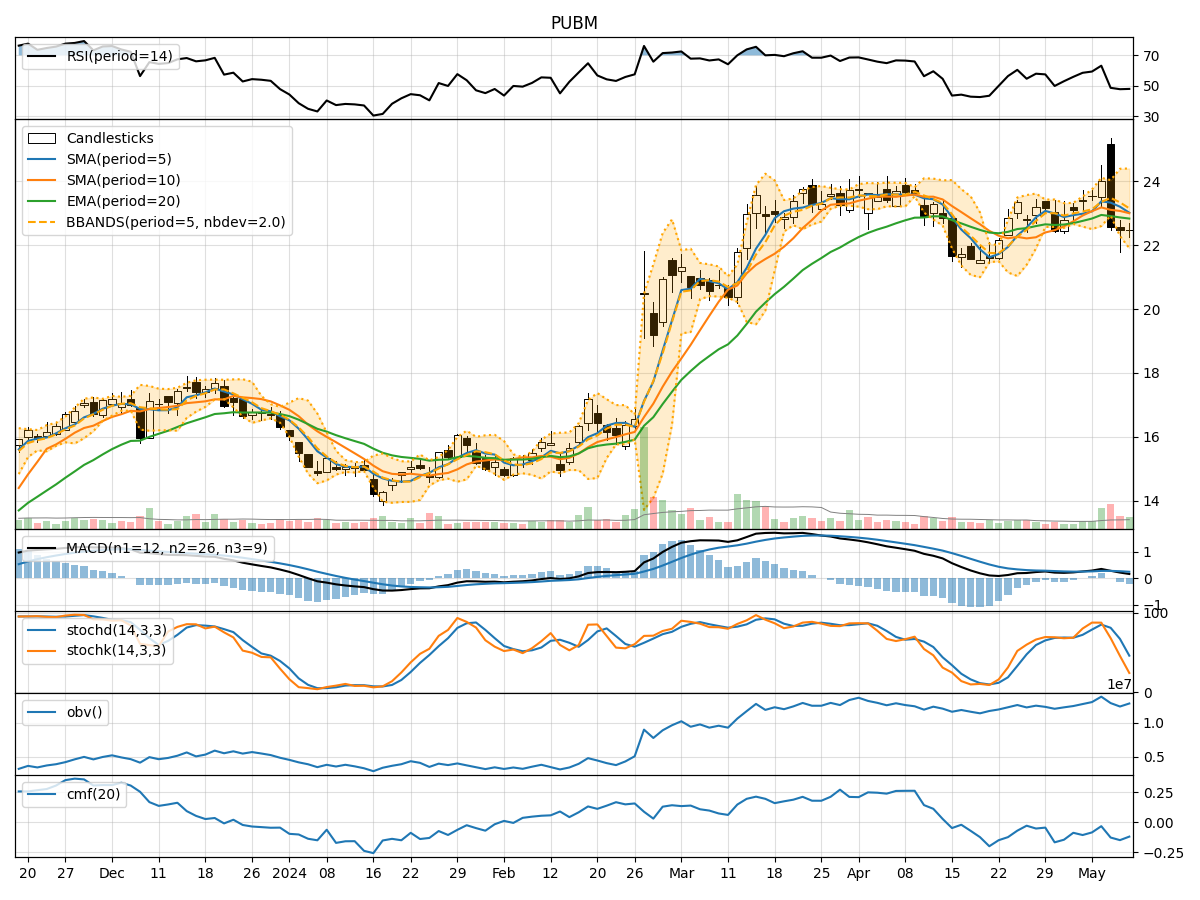
In analyzing the technical indicators for PUBM over the last 5 days, we will delve into the trend, momentum, volatility, and volume indicators to provide a comprehensive assessment of the stock's potential price movement. By examining these key factors, we aim to offer valuable insights and predictions for the next few days.
Trend Indicators:
- Moving Averages (MA): The 5-day MA has been fluctuating around the stock's closing prices, indicating short-term price trends. The SMA(10) and EMA(20) have shown slight variations but have not provided a clear trend direction.
- MACD: The MACD line has been positive, indicating a bullish momentum, although the recent decrease in MACD histogram suggests a potential weakening of the bullish trend.
Momentum Indicators:
- RSI: The RSI has been hovering around the neutral zone, indicating a lack of strong buying or selling pressure.
- Stochastic Oscillator: Both %K and %D have been declining, suggesting a potential bearish momentum.
- Williams %R: The indicator has been in oversold territory, indicating a potential reversal in the short term.
Volatility Indicators:
- Bollinger Bands: The bands have been narrowing, indicating decreasing volatility in the stock's price movements.
- Bollinger %B: The %B has been fluctuating around the midline, suggesting a lack of clear trend direction.
Volume Indicators:
- On-Balance Volume (OBV): The OBV has been fluctuating, indicating a balance between buying and selling pressure.
- Chaikin Money Flow (CMF): The CMF has been negative, indicating a potential outflow of money from the stock.
Key Observations and Opinions:
- Trend: The trend indicators show mixed signals with no clear direction. The MACD suggests a weakening bullish momentum.
- Momentum: The momentum indicators indicate a potential shift towards bearish sentiment, especially with the Stochastic Oscillator in oversold territory.
- Volatility: Volatility has been decreasing, indicating a possible period of consolidation or sideways movement.
- Volume: The volume indicators suggest a balance between buying and selling pressure, with a slight negative bias indicated by the CMF.
Conclusion:
Based on the analysis of the technical indicators, the next few days for PUBM could see sideways movement with a slight bearish bias. Traders should exercise caution and closely monitor key levels such as support and resistance for potential entry or exit points. It is advisable to wait for clearer signals or confirmation of a trend before making significant trading decisions.