Technical Analysis of RDUS 2024-05-03
Overview:
In analyzing the technical indicators for RDUS over the last 5 days, we will delve into the trend, momentum, volatility, and volume indicators to provide a comprehensive outlook on the possible stock price movement. By examining these key aspects, we aim to offer valuable insights and predictions for the upcoming days.
Trend Indicators:
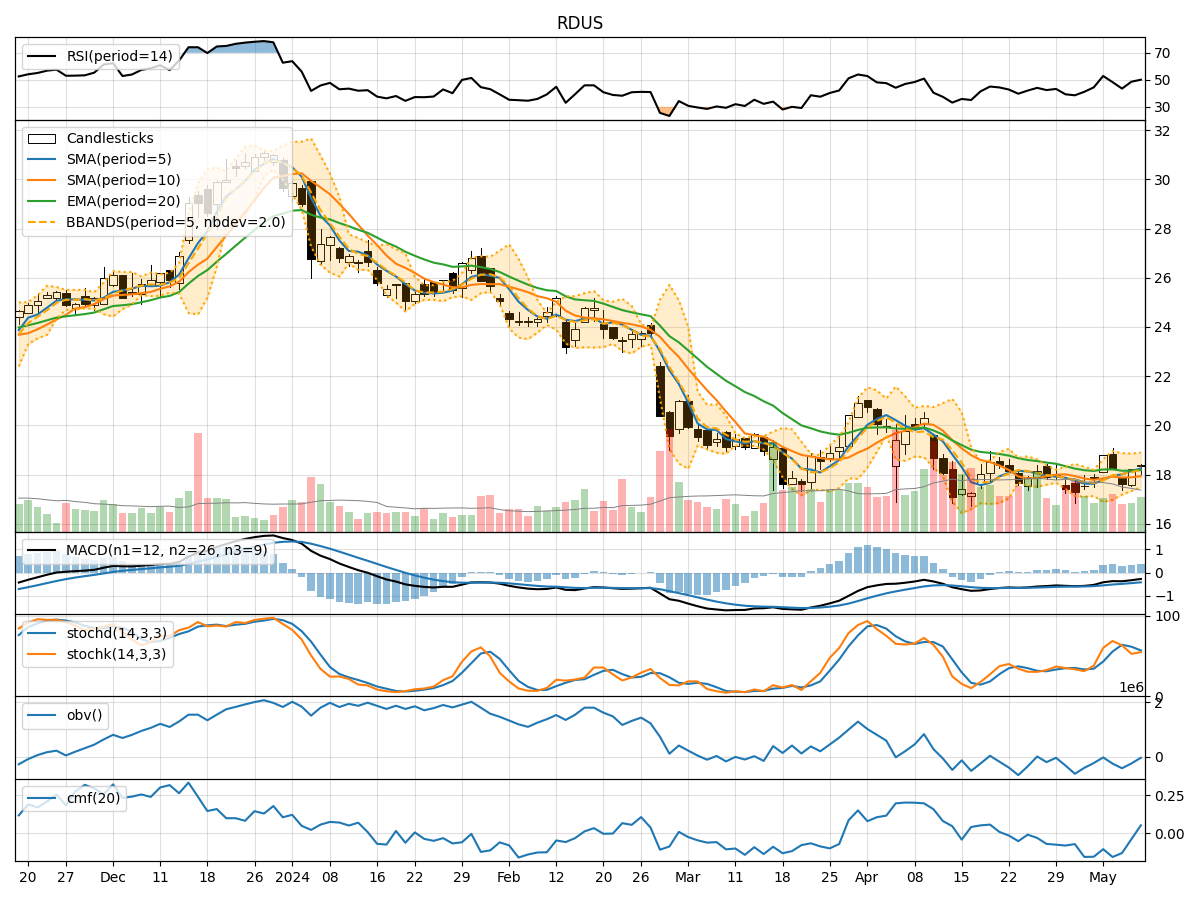
- Moving Averages (MA): The 5-day MA has been fluctuating around the closing prices, indicating a lack of clear trend direction.
- MACD: The MACD line has been consistently below the signal line, suggesting a bearish momentum in the short term.
- RSI: The RSI values have been hovering around the mid-range, reflecting a neutral sentiment in terms of momentum.
Momentum Indicators:
- Stochastic Oscillator: Both %K and %D values have been fluctuating, indicating indecision in the market.
- Williams %R: The values have been oscillating within the oversold and neutral zones, signaling potential reversal points.
Volatility Indicators:
- Bollinger Bands: The bands have been narrowing, indicating decreasing volatility and a potential breakout in the near future.
- Average True Range (ATR): ATR values have been relatively stable, suggesting a lack of significant price movements.
Volume Indicators:
- On-Balance Volume (OBV): The OBV values have been declining, indicating selling pressure in the market.
- Chaikin Money Flow (CMF): The CMF values have been negative, suggesting outflows from the stock.
Key Observations and Opinions:
- Trend: The lack of a clear trend in the moving averages and the bearish signal from the MACD indicate a potential downward bias in the short term.
- Momentum: The oscillations in the stochastic and Williams %R indicators suggest a period of consolidation or indecision among traders.
- Volatility: The narrowing Bollinger Bands point towards a potential breakout, while the stable ATR values indicate a lack of significant price movements.
- Volume: The declining OBV and negative CMF values highlight selling pressure and bearish sentiment in the market.
Conclusion:
Based on the analysis of the technical indicators, the next few days for RDUS are likely to see downward price movement with a potential for further consolidation. The bearish signals from the trend and volume indicators, coupled with the lack of clear momentum, suggest a cautious approach for investors. Traders should closely monitor key support levels and be prepared for increased volatility as the stock navigates through this period of uncertainty.