Technical Analysis of ROKU 2024-05-10
Overview:
In analyzing the technical indicators for ROKU over the last 5 days, we will delve into the trend, momentum, volatility, and volume indicators to provide a comprehensive outlook on the possible stock price movement. By examining these key factors, we aim to offer valuable insights and predictions for the upcoming days.
Trend Analysis:
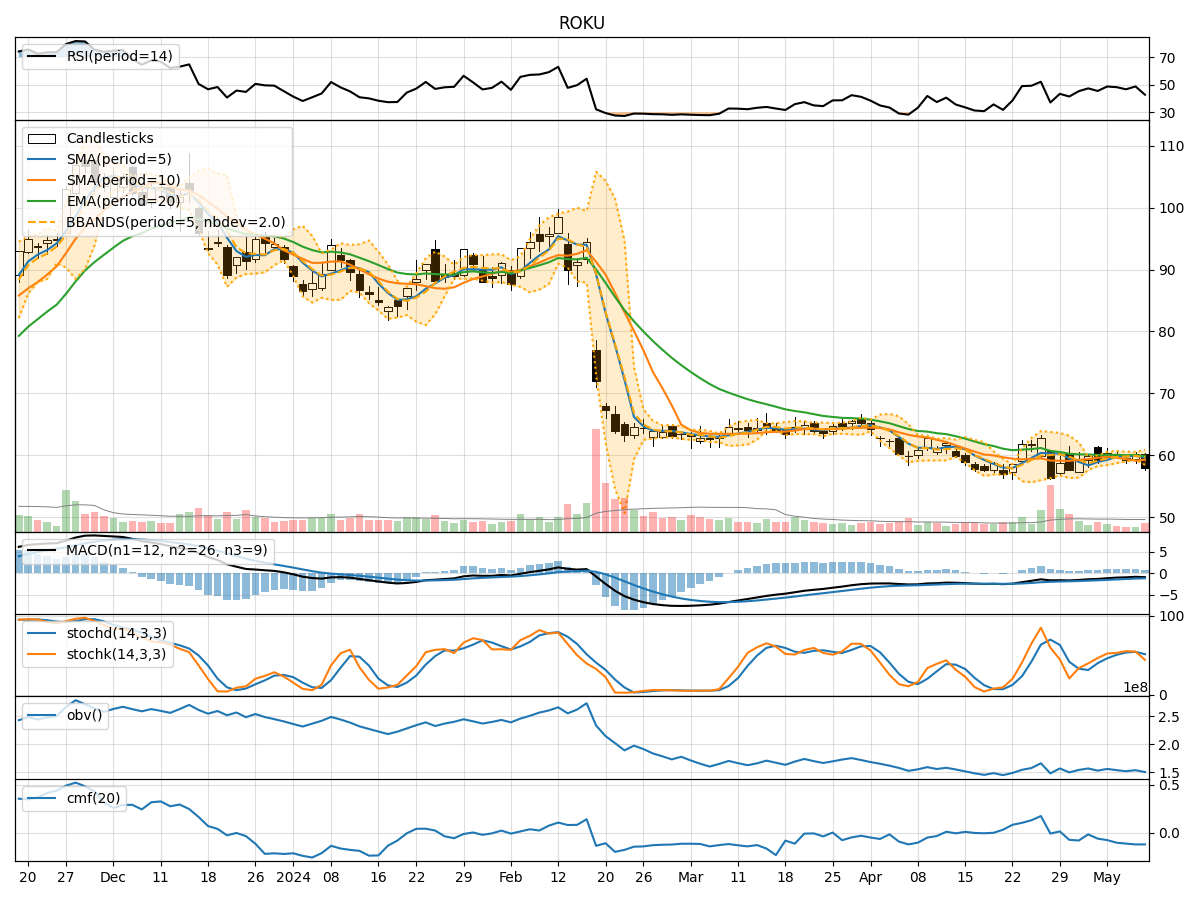
- Moving Averages (MA): The 5-day Moving Average (MA) has been fluctuating around the 59-60 range, indicating a relatively stable trend in the short term.
- MACD: The Moving Average Convergence Divergence (MACD) has been negative, suggesting a bearish momentum in the stock price.
- EMA: The Exponential Moving Average (EMA) has been slightly declining, reflecting a weakening trend.
Key Observation: The trend indicators point towards a bearish sentiment in the stock price movement.
Momentum Analysis:
- RSI: The Relative Strength Index (RSI) has been hovering around the mid-40s to 50, indicating a neutral momentum.
- Stochastic Oscillator: The Stochastic Oscillator shows mixed signals with fluctuations in the %K and %D values.
- Williams %R: The Williams %R is in the oversold territory, suggesting a potential reversal.
Key Observation: The momentum indicators suggest a neutral to slightly bearish momentum in the stock.
Volatility Analysis:
- Bollinger Bands: The Bollinger Bands have shown narrowing volatility, indicating a potential decrease in price fluctuations.
- Bollinger %B: The %B indicator is close to the lower band, signaling a possible oversold condition.
Key Observation: Volatility indicators imply a reduced volatility in the stock price.
Volume Analysis:
- On-Balance Volume (OBV): The OBV has been declining, indicating selling pressure in the stock.
- Chaikin Money Flow (CMF): The CMF is negative, suggesting a bearish money flow trend.
Key Observation: Volume indicators reflect increased selling pressure in the stock.
Conclusion:
Based on the analysis of trend, momentum, volatility, and volume indicators, the overall outlook for ROKU in the next few days appears to be bearish. The trend indicators signal a weakening trend, while momentum indicators show a neutral to slightly bearish sentiment. Volatility indicators point towards reduced price fluctuations, and volume indicators indicate increased selling pressure.
Therefore, the possible stock price movement for ROKU in the next few days is likely to be on a downward trajectory. Traders and investors should exercise caution and consider potential short-selling opportunities or wait for a more favorable entry point.