Technical Analysis of SAVA 2024-05-10
Overview:
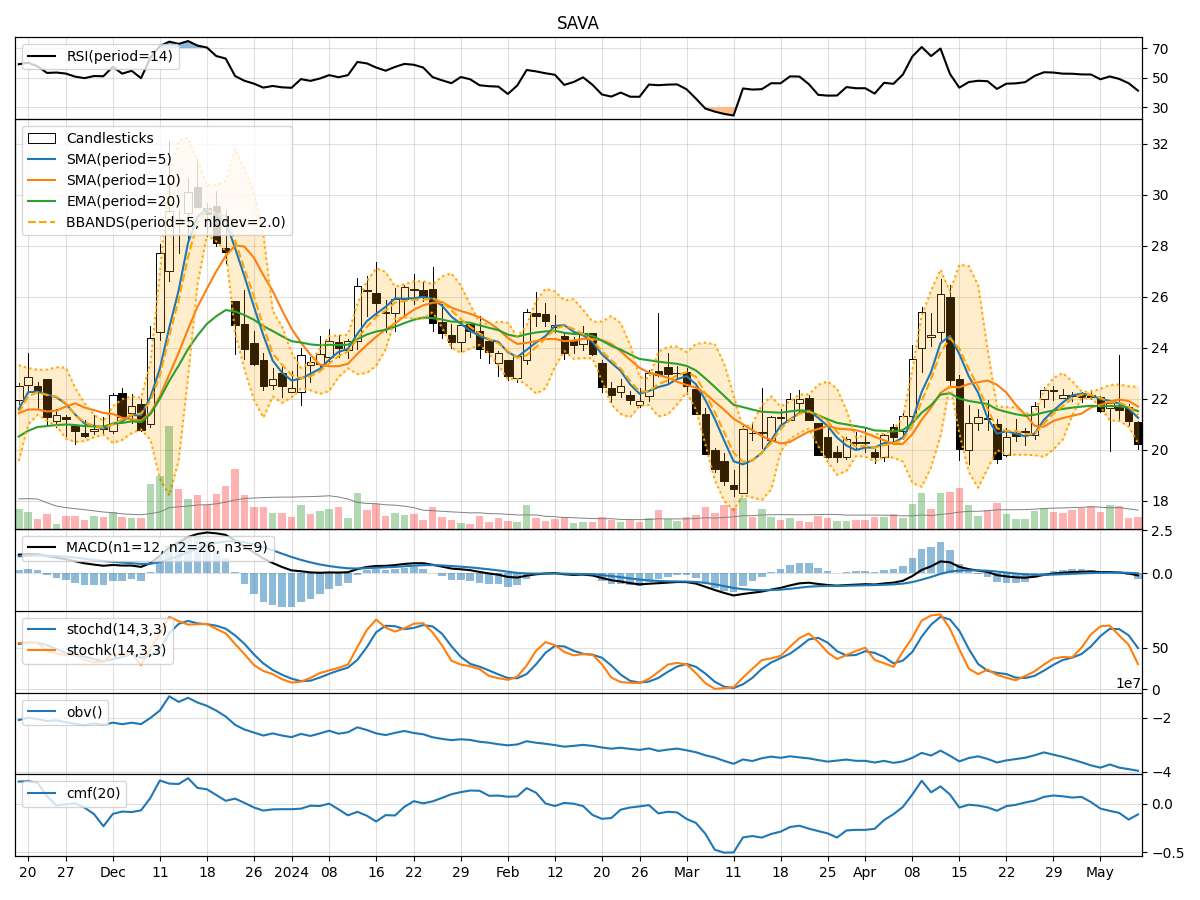
In analyzing the technical indicators for SAVA over the last 5 days, we will delve into the trend, momentum, volatility, and volume indicators to provide a comprehensive outlook on the possible stock price movement. By examining these key aspects, we aim to offer valuable insights and predictions for the upcoming days.
Trend Analysis:
- Moving Averages (MA): The 5-day MA has been fluctuating around the closing prices, indicating short-term price trends. The SMA(10) and EMA(20) have shown a slight decline, suggesting a weakening trend.
- MACD: The MACD line has been negative, with the MACD histogram showing a decreasing trend. This indicates a bearish momentum in the stock price.
Momentum Analysis:
- RSI: The RSI has been hovering around the mid-range, indicating a neutral sentiment in the market.
- Stochastic Oscillator: Both %K and %D have been declining, reaching oversold levels, suggesting a potential reversal in the stock price.
Volatility Analysis:
- Bollinger Bands (BB): The stock price has been trading below the lower Bollinger Band, indicating oversold conditions. This could signal a potential reversal or bounce back in the price.
Volume Analysis:
- On-Balance Volume (OBV): The OBV has been consistently negative, indicating selling pressure in the stock.
- Chaikin Money Flow (CMF): The CMF has been negative, reflecting a lack of buying interest in the stock.
Key Observations:
- The stock is currently in a bearish phase, as indicated by the declining moving averages, negative MACD, and oversold stochastic levels.
- Volatility is high, with the stock trading below the lower Bollinger Band, suggesting a possible reversal or bounce back.
- The negative OBV and CMF indicate a lack of buying interest and persistent selling pressure in the stock.
Conclusion:
Based on the analysis of the technical indicators, the stock is likely to experience further downward movement in the next few days. The bearish trend, oversold stochastic levels, and negative volume indicators all point towards a continuation of the current downward trajectory. Traders and investors should exercise caution and consider shorting or staying on the sidelines until signs of a reversal or consolidation emerge.