Technical Analysis of SIFY 2024-05-10
Overview:
In analyzing the technical indicators for SIFY over the last 5 days, we will delve into the trend, momentum, volatility, and volume indicators to provide a comprehensive outlook on the possible stock price movement. By examining these key aspects, we aim to offer valuable insights and predictions for the upcoming days.
Trend Analysis:
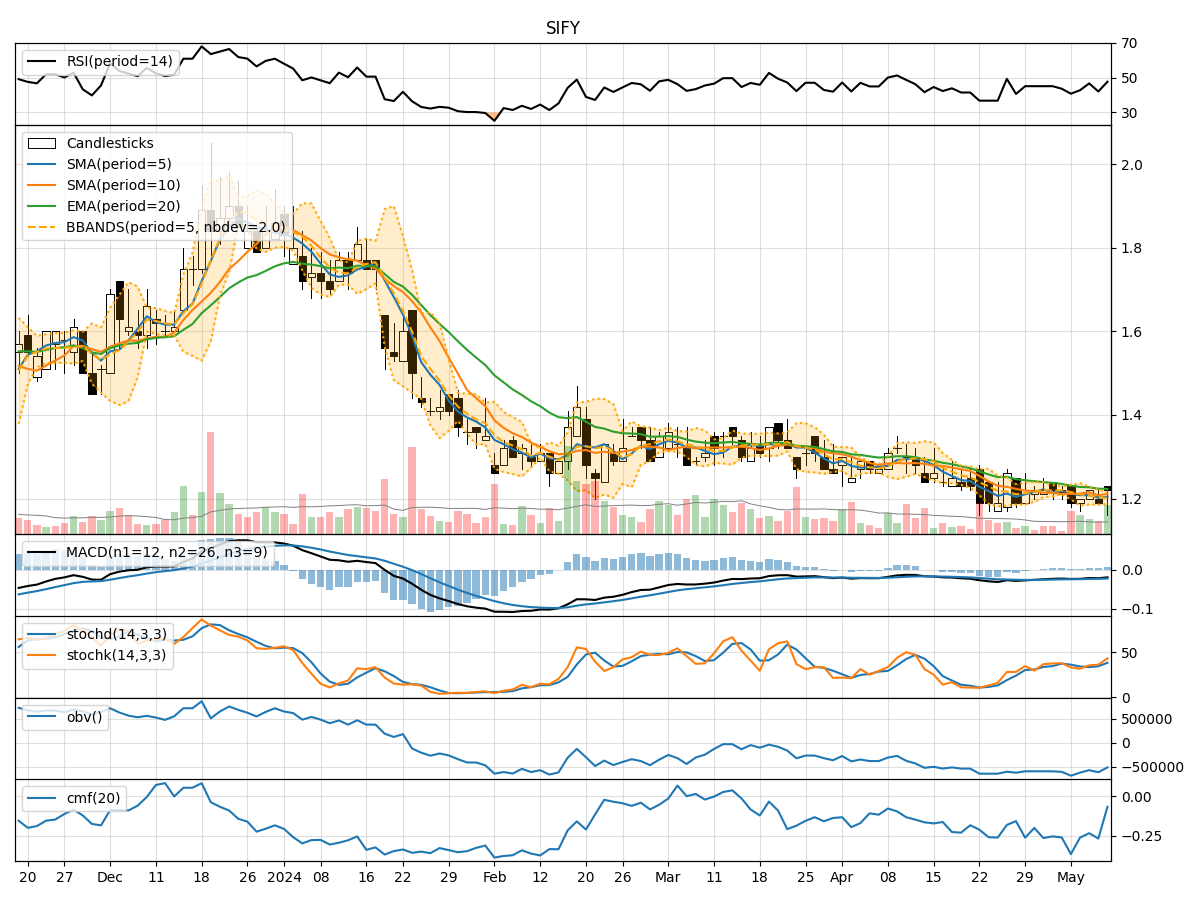
- Moving Averages (MA): The 5-day MA has been fluctuating around the current price, indicating a lack of clear trend direction.
- MACD: The MACD line has been consistently below the signal line, suggesting a bearish momentum in the short term.
Momentum Analysis:
- RSI: The RSI has been hovering around the mid-range, indicating a neutral momentum.
- Stochastic Oscillator: The Stochastic indicators have shown some upward movement, hinting at a potential bullish momentum.
Volatility Analysis:
- Bollinger Bands (BB): The Bollinger Bands have widened, indicating increased volatility in the stock price.
Volume Analysis:
- On-Balance Volume (OBV): The OBV has shown mixed signals, reflecting indecision among investors.
- Chaikin Money Flow (CMF): The CMF has been negative, suggesting a lack of buying pressure.
Key Observations:
- The trend indicators show a lack of clear direction, with the MACD signaling a bearish bias.
- Momentum indicators suggest a neutral stance, with a slight bullish inclination from the Stochastic oscillator.
- Volatility has increased, as indicated by the widening Bollinger Bands.
- Volume indicators reflect mixed signals, with OBV showing selling pressure and CMF indicating a lack of buying interest.
Conclusion:
Based on the analysis of the technical indicators, the stock price of SIFY is likely to experience continued volatility in the upcoming days. The bearish bias from the MACD and the mixed signals from the volume indicators suggest a sideways movement or consolidation in the short term. However, the slight bullish momentum indicated by the Stochastic oscillator could lead to temporary price increases. Investors should exercise caution and closely monitor the price action for potential entry or exit points.
Recommendation:
Given the current market dynamics, it is advisable for investors to wait for more clarity in the price trend before making significant trading decisions. Setting tight stop-loss orders and monitoring key support and resistance levels can help manage risk effectively in this uncertain market environment. Additionally, staying informed about any significant news or events that could impact the stock price is crucial for making informed investment choices.