Technical Analysis of SNPO 2024-05-10
Overview:
In analyzing the technical indicators for SNPO over the last 5 days, we will delve into the trend, momentum, volatility, and volume indicators to provide a comprehensive assessment of the stock's potential price movement. By examining these key factors, we aim to offer insights into the possible future direction of SNPO's stock price.
Trend Analysis:
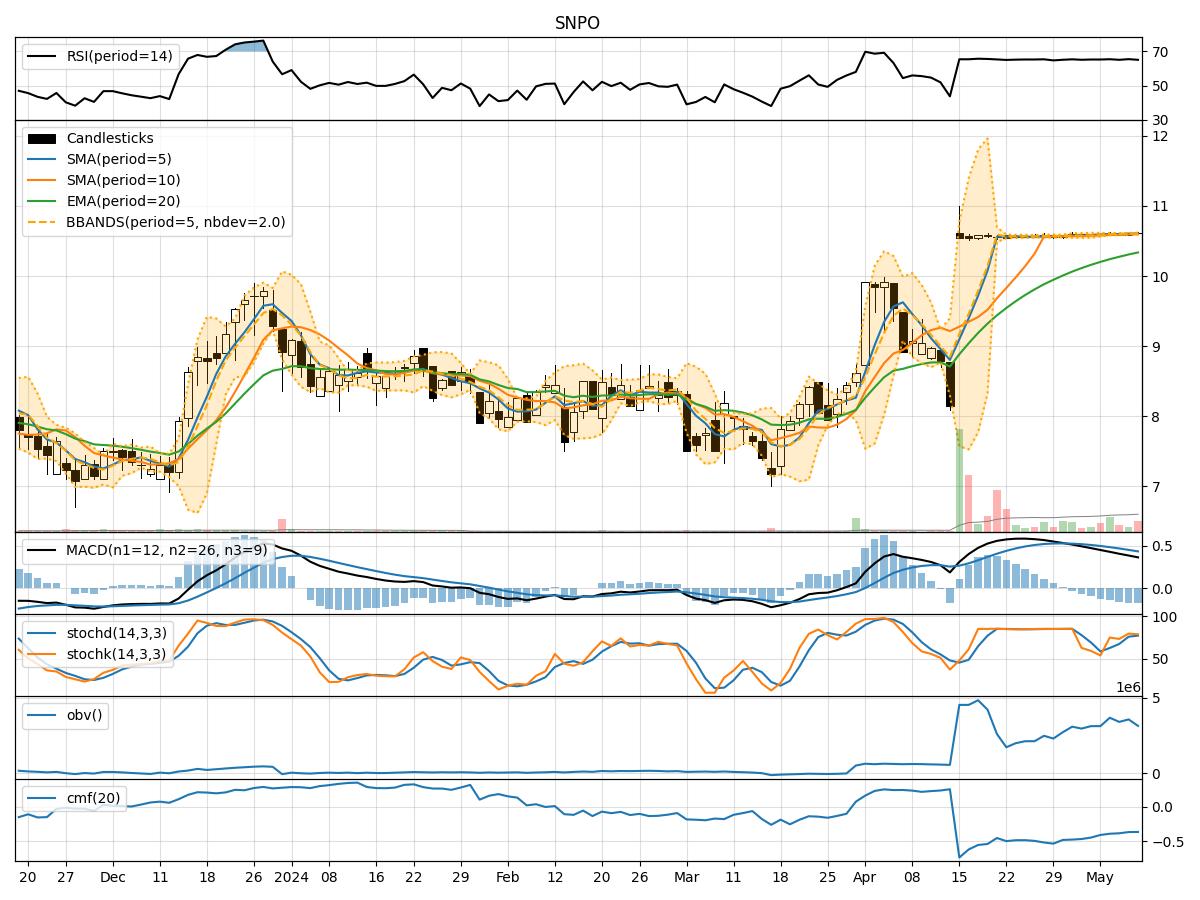
- Moving Averages (MA): The 5-day Moving Average (MA) has been relatively stable around $10.60, indicating a consistent price level in the short term.
- MACD: The Moving Average Convergence Divergence (MACD) has shown a decreasing trend in the MACD line, suggesting a potential weakening of bullish momentum.
- RSI: The Relative Strength Index (RSI) has hovered around 65, indicating a neutral sentiment without strong overbought or oversold conditions.
Key Observation: The trend indicators suggest a lack of significant directional bias in the short term.
Momentum Analysis:
- Stochastic Oscillator: The Stochastic Oscillator has shown fluctuations but remains in the overbought territory, indicating a potential slowdown in price momentum.
- Williams %R: The Williams %R is also in the overbought region, signaling a possible reversal or consolidation phase.
Key Observation: Momentum indicators point towards a potential slowdown or consolidation in price movement.
Volatility Analysis:
- Bollinger Bands: The Bollinger Bands have shown narrowing bands, indicating decreasing volatility and a potential period of consolidation.
- Volatility Bands: The Volatility Bands have tightened, suggesting a decrease in price fluctuations.
Key Observation: Volatility indicators signal a period of reduced price volatility and a possible consolidation phase.
Volume Analysis:
- On-Balance Volume (OBV): The OBV has shown mixed movements, indicating indecision among market participants regarding the stock.
- Chaikin Money Flow (CMF): The CMF has been negative, reflecting selling pressure in the stock.
Key Observation: Volume indicators suggest a lack of strong buying interest and potential selling pressure.
Conclusion:
Based on the analysis of trend, momentum, volatility, and volume indicators, the stock price of SNPO is likely to experience a sideways movement or consolidation in the upcoming days. The lack of clear directional signals from the technical indicators, coupled with the indications of reduced volatility and mixed volume movements, suggests a period of indecision and potential price stabilization.
Recommendation: As an investor, it may be prudent to exercise caution and closely monitor the stock for any breakout or reversal signals before making significant trading decisions.