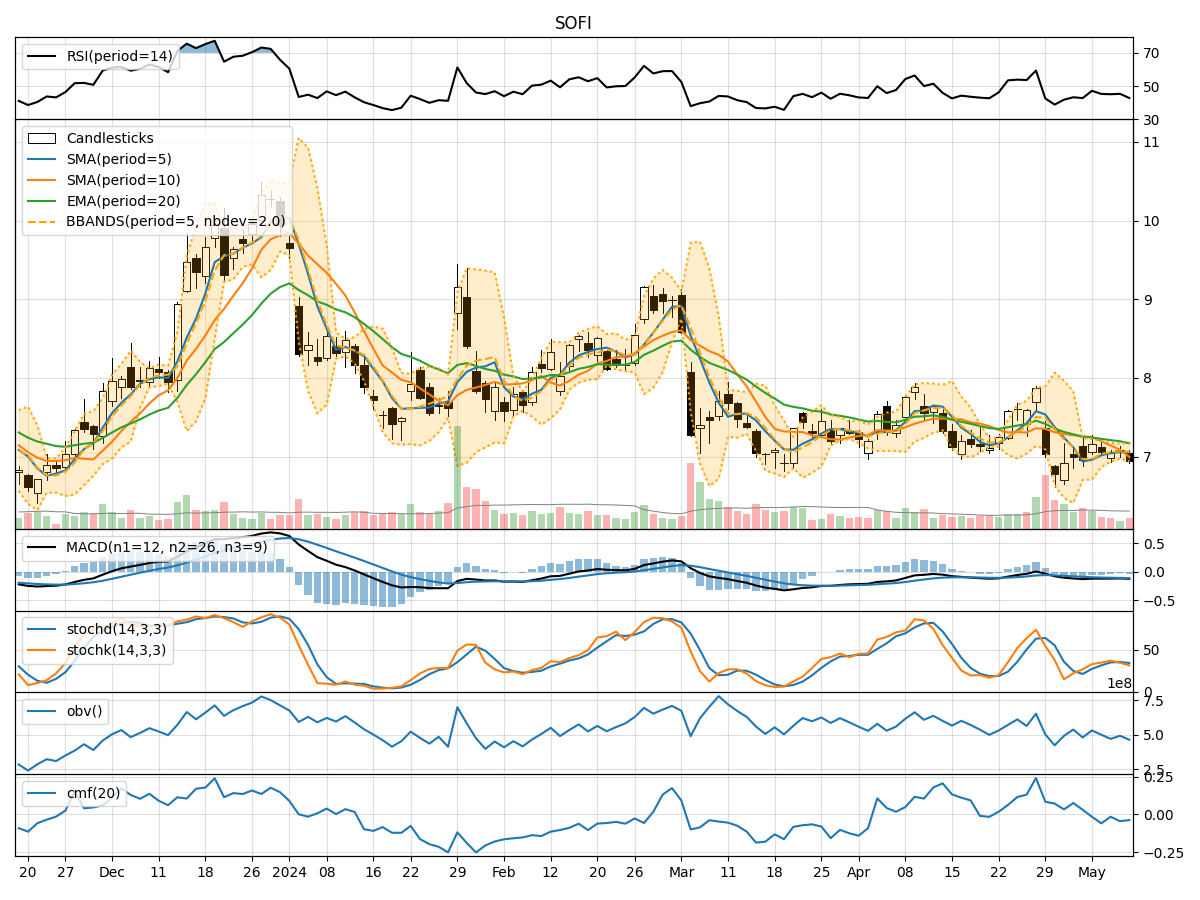
Technical Analysis of SOFI 2024-05-10
Overview:
In analyzing the technical indicators for SOFI over the last 5 days, we will delve into the trend, momentum, volatility, and volume indicators to provide a comprehensive assessment of the stock's potential price movement. By examining these key factors, we aim to offer valuable insights and predictions for the next few days.
Trend Analysis:
- Moving Averages (MA): The 5-day MA has been fluctuating around the closing prices, indicating a lack of clear trend direction.
- MACD: The MACD line has been consistently below the signal line, suggesting a bearish momentum in the short term.
- RSI: The RSI values have been hovering around the mid-range, indicating a neutral sentiment among traders.
Momentum Analysis:
- Stochastic Oscillator: Both %K and %D values have been declining, signaling a potential bearish momentum.
- Williams %R: The Williams %R values have been consistently in the oversold territory, indicating a possible reversal or continuation of the downtrend.
Volatility Analysis:
- Bollinger Bands (BB): The stock price has been trading within the bands, with the %B indicator showing a slight deviation from the middle band.
- Average True Range (ATR): The ATR values have been relatively stable, suggesting consistent price movements without significant spikes.
Volume Analysis:
- On-Balance Volume (OBV): The OBV values have been fluctuating, indicating mixed buying and selling pressure.
- Chaikin Money Flow (CMF): The CMF values have been negative, suggesting a bearish money flow in the short term.
Key Observations:
- The trend indicators show a lack of clear direction, with the MACD signaling a bearish momentum.
- Momentum indicators point towards a potential continuation of the bearish trend, as seen in the Stochastic Oscillator and Williams %R.
- Volatility remains relatively stable, with the stock price trading within the Bollinger Bands.
- Volume indicators reflect mixed sentiment, with the OBV fluctuating and CMF indicating bearish money flow.
Conclusion:
Based on the analysis of the technical indicators, the outlook for SOFI in the next few days appears bearish. The trend indicators lack a clear direction, while momentum indicators suggest a continuation of the bearish momentum. Volatility remains stable, and volume indicators reflect mixed sentiment. Therefore, it is likely that the stock price may experience further downward movement in the upcoming trading sessions. Traders and investors should exercise caution and consider risk management strategies in light of the bearish signals provided by the technical analysis.