Technical Analysis of STX 2024-05-10
Overview:
In analyzing the technical indicators for STX over the last 5 days, we will delve into the trend, momentum, volatility, and volume indicators to provide a comprehensive outlook on the possible stock price movement. By examining these key factors, we aim to offer valuable insights and predictions for the upcoming days.
Trend Analysis:
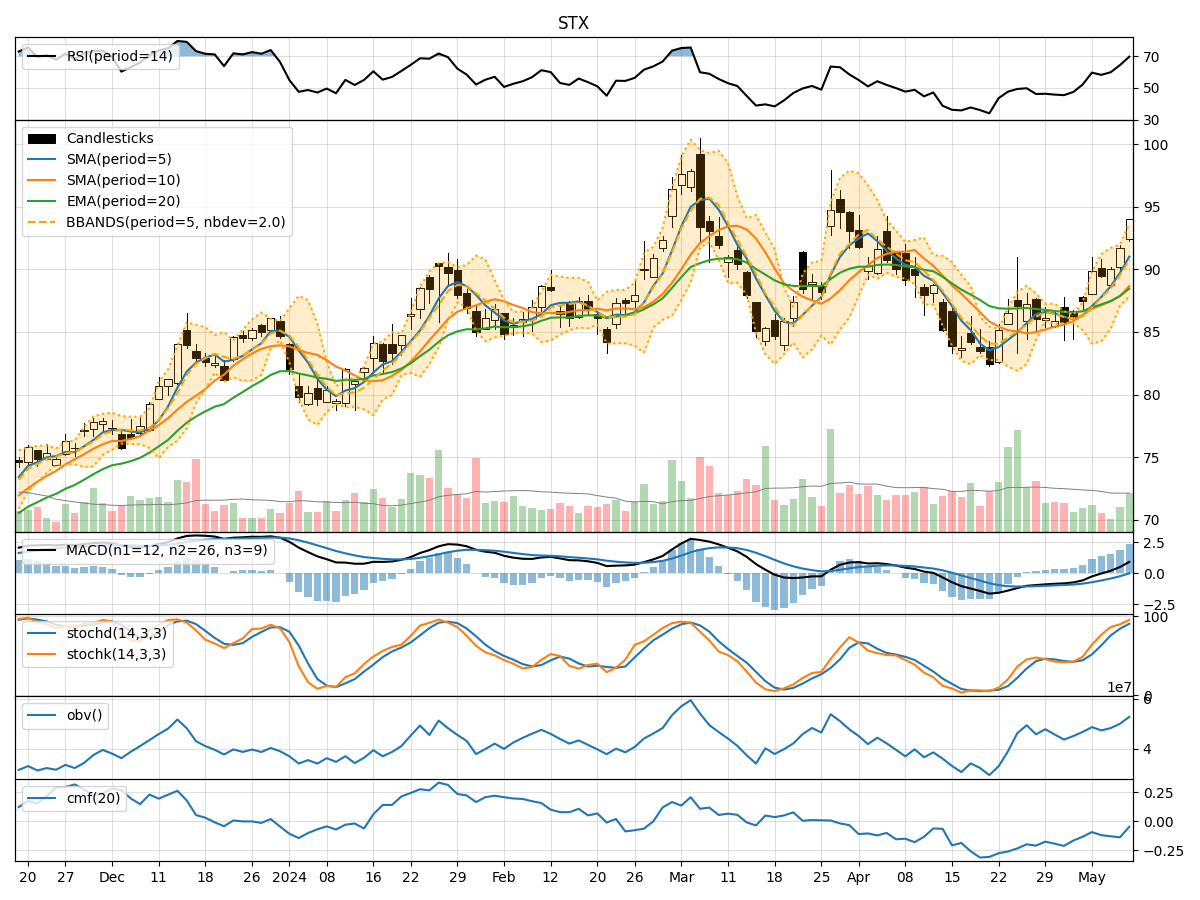
- Moving Averages (MA): The 5-day Moving Average has been consistently rising, indicating a bullish trend in the short term.
- MACD: The MACD line has been increasing, crossing above the signal line, suggesting a bullish momentum.
- EMA: The Exponential Moving Average has been trending upwards, supporting the bullish sentiment.
Momentum Analysis:
- RSI: The Relative Strength Index has been climbing, indicating increasing buying pressure and potential overbought conditions.
- Stochastic Oscillator: Both %K and %D have been rising, signaling strong bullish momentum.
- Williams %R: The indicator is close to the oversold territory, suggesting a potential reversal or consolidation.
Volatility Analysis:
- Bollinger Bands: The price has been consistently trading above the middle band, indicating an uptrend with moderate volatility.
- Bollinger %B: The %B indicator is above 0.8, suggesting the stock is trading near the upper band, potentially overbought.
Volume Analysis:
- On-Balance Volume (OBV): The OBV has been steadily increasing, reflecting accumulation and supporting the bullish trend.
- Chaikin Money Flow (CMF): The CMF has been negative, indicating some selling pressure despite the price increase.
Key Observations:
- The trend indicators, momentum oscillators, and volume indicators all point towards a strong bullish sentiment in the short term.
- The stock is currently in an uptrend with increasing buying pressure and positive momentum signals.
- However, the overbought conditions indicated by RSI and Stochastic %K suggest a potential pullback or consolidation in the near future.
- The volatility remains moderate, with the price trading near the upper Bollinger Band, indicating a potential resistance level.
Conclusion:
Based on the analysis of the technical indicators, the next few days are likely to see the stock price of STX continue its upward trajectory with potential for further gains. However, traders should be cautious of the overbought conditions and the possibility of a short-term pullback or consolidation. It is advisable to closely monitor the price action and key support levels for any signs of a reversal. Overall, the outlook for STX remains bullish in the short term, but prudent risk management is essential in navigating potential market fluctuations.