Technical Analysis of TCOM 2024-05-10
Overview:
In analyzing the technical indicators for TCOM over the last 5 days, we will delve into the trend, momentum, volatility, and volume indicators to provide a comprehensive outlook on the possible stock price movement. By examining these key aspects, we aim to offer valuable insights and predictions for the upcoming days.
Trend Analysis:
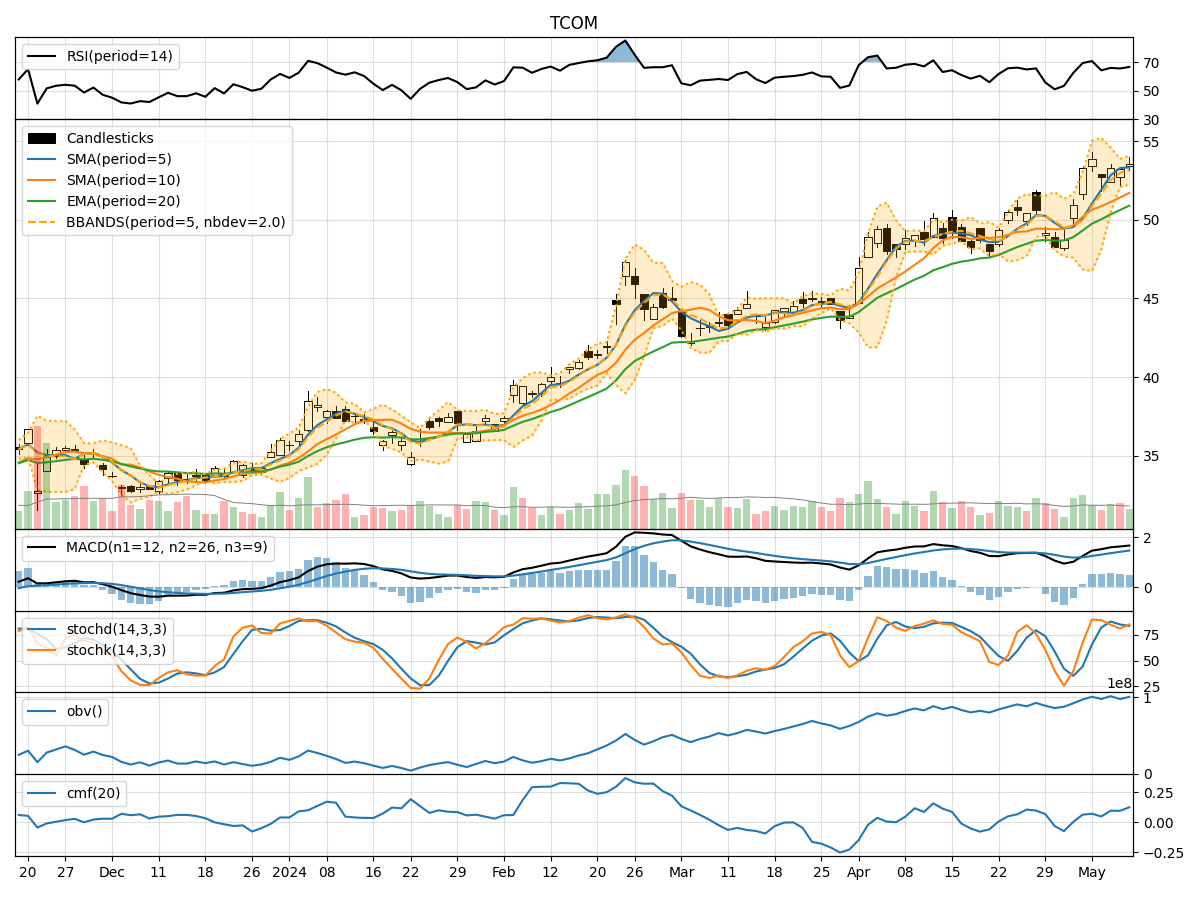
- Moving Averages (MA): The 5-day Moving Average has been consistently above the Simple Moving Average (SMA) of 10 days, indicating a short-term bullish trend.
- Exponential Moving Average (EMA): The EMA has been steadily increasing, reflecting positive momentum in the stock price.
- Moving Average Convergence Divergence (MACD): The MACD and Signal Line have been in an uptrend, suggesting bullish momentum.
Momentum Analysis:
- Relative Strength Index (RSI): The RSI has been hovering around 65-70, indicating a neutral to slightly overbought condition.
- Stochastic Oscillator: Both %K and %D have shown fluctuations but remained in the overbought territory, signaling potential for a pullback.
- Williams %R (Willams %R): The Williams %R has been oscillating near oversold levels, suggesting a possible reversal.
Volatility Analysis:
- Bollinger Bands (BB): The stock price has been trading within the Bollinger Bands, with the bands widening slightly, indicating increased volatility.
- Bollinger Band Percentage (BBP): The BBP has shown fluctuations but has generally remained within the bands, signifying a range-bound movement.
Volume Analysis:
- On-Balance Volume (OBV): The OBV has shown mixed signals, with no clear trend in volume accumulation or distribution.
- Chaikin Money Flow (CMF): The CMF has been positive, indicating buying pressure in the stock.
Key Observations:
- The stock is currently in an upward trend based on moving averages and MACD.
- Momentum indicators suggest a potential pullback due to overbought conditions.
- Volatility has increased slightly, indicating potential price swings.
- Volume indicators show mixed signals with no clear trend in volume accumulation.
Conclusion:
Based on the analysis of technical indicators, the next few days for TCOM could see a short-term pullback in the stock price due to overbought conditions indicated by momentum indicators. However, the overall trend remains bullish, supported by moving averages and MACD. Traders should be cautious of potential volatility and monitor key support levels for potential buying opportunities.