Technical Analysis of TEAM 2024-05-10
Overview:
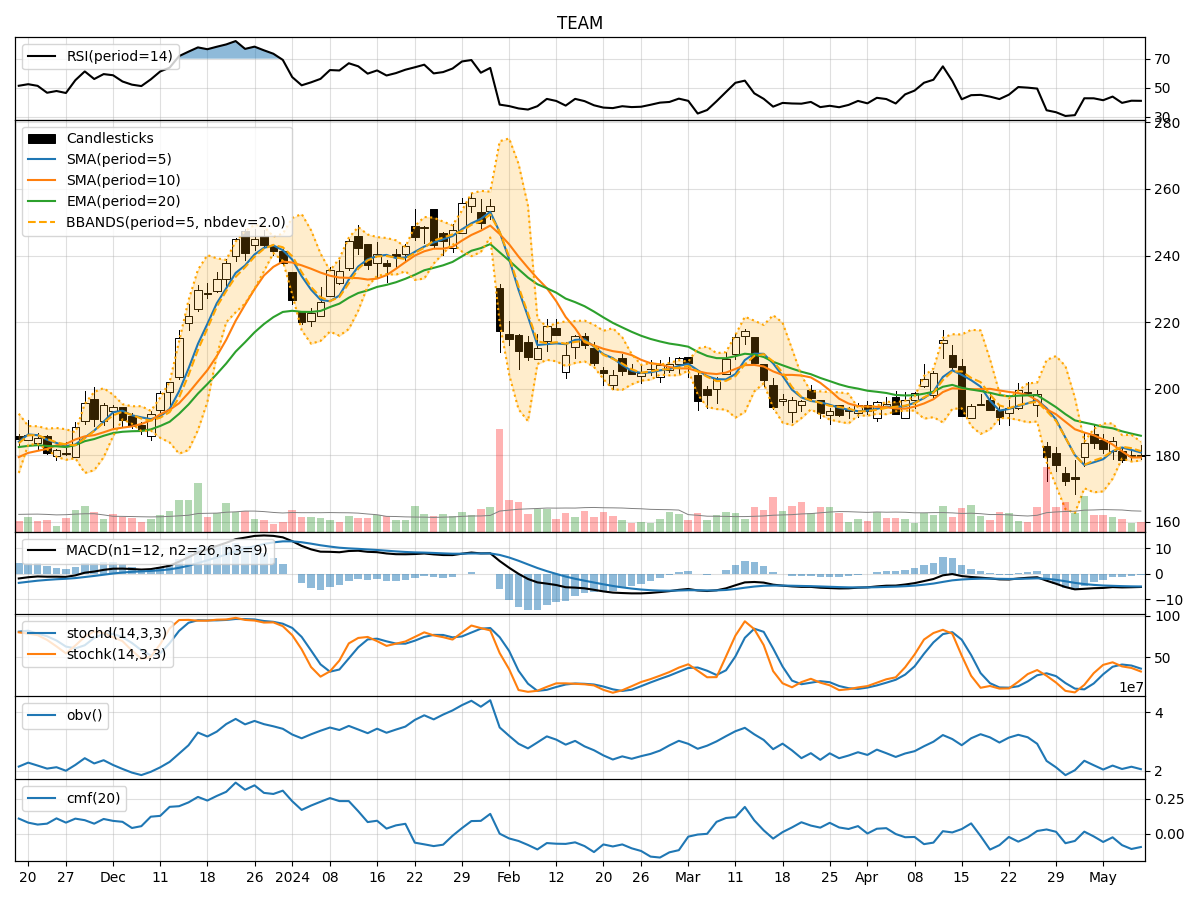
In analyzing the technical indicators for the stock of TEAM over the last 5 days, we will delve into the trend, momentum, volatility, and volume indicators to provide a comprehensive outlook on the possible future stock price movement. By examining these key indicators, we aim to offer valuable insights and predictions for the upcoming trading days.
Trend Analysis:
- Moving Averages (MA): The 5-day Moving Average (MA) has been fluctuating around the closing prices, indicating short-term price trends. The Simple Moving Average (SMA) and Exponential Moving Average (EMA) show a downward trend, suggesting a bearish sentiment.
- MACD: The Moving Average Convergence Divergence (MACD) is negative, with the MACD line below the signal line, indicating a bearish trend in the stock price.
- Momentum: The momentum indicators are also showing a downward trend, with the Relative Strength Index (RSI) below 50, indicating a weakening momentum.
Momentum Analysis:
- RSI: The RSI is below 50, suggesting a bearish momentum in the stock.
- Stochastic Oscillator: Both %K and %D lines of the Stochastic Oscillator are trending downwards, indicating a potential continuation of the bearish momentum.
- Williams %R: The Williams %R is in the oversold territory, indicating a bearish sentiment in the market.
Volatility Analysis:
- Bollinger Bands: The Bollinger Bands are narrowing, indicating decreasing volatility in the stock price. The bands are squeezing, which could lead to a breakout in either direction.
- Bollinger %B: The %B indicator is below 0.5, suggesting that the stock is trading below the lower Bollinger Band, indicating a potential oversold condition.
Volume Analysis:
- On-Balance Volume (OBV): The OBV has been declining over the last 5 days, indicating selling pressure in the stock.
- Chaikin Money Flow (CMF): The CMF is negative, suggesting that money is flowing out of the stock, indicating a bearish sentiment.
Conclusion:
Based on the analysis of the technical indicators, the stock of TEAM is currently in a bearish phase. The trend indicators, momentum oscillators, volatility bands, and volume indicators all point towards a downward movement in the stock price in the upcoming trading days. Traders and investors should exercise caution and consider shorting or staying away from long positions until there are clear signs of a trend reversal. The stock is likely to experience further downside pressure in the near term.