Technical Analysis of TTD 2024-05-10
Overview:
In analyzing the technical indicators for TTD over the last 5 days, we will delve into the trend, momentum, volatility, and volume indicators to provide a comprehensive outlook on the possible stock price movement in the coming days. By examining these key aspects, we aim to offer valuable insights and predictions for informed decision-making.
Trend Analysis:
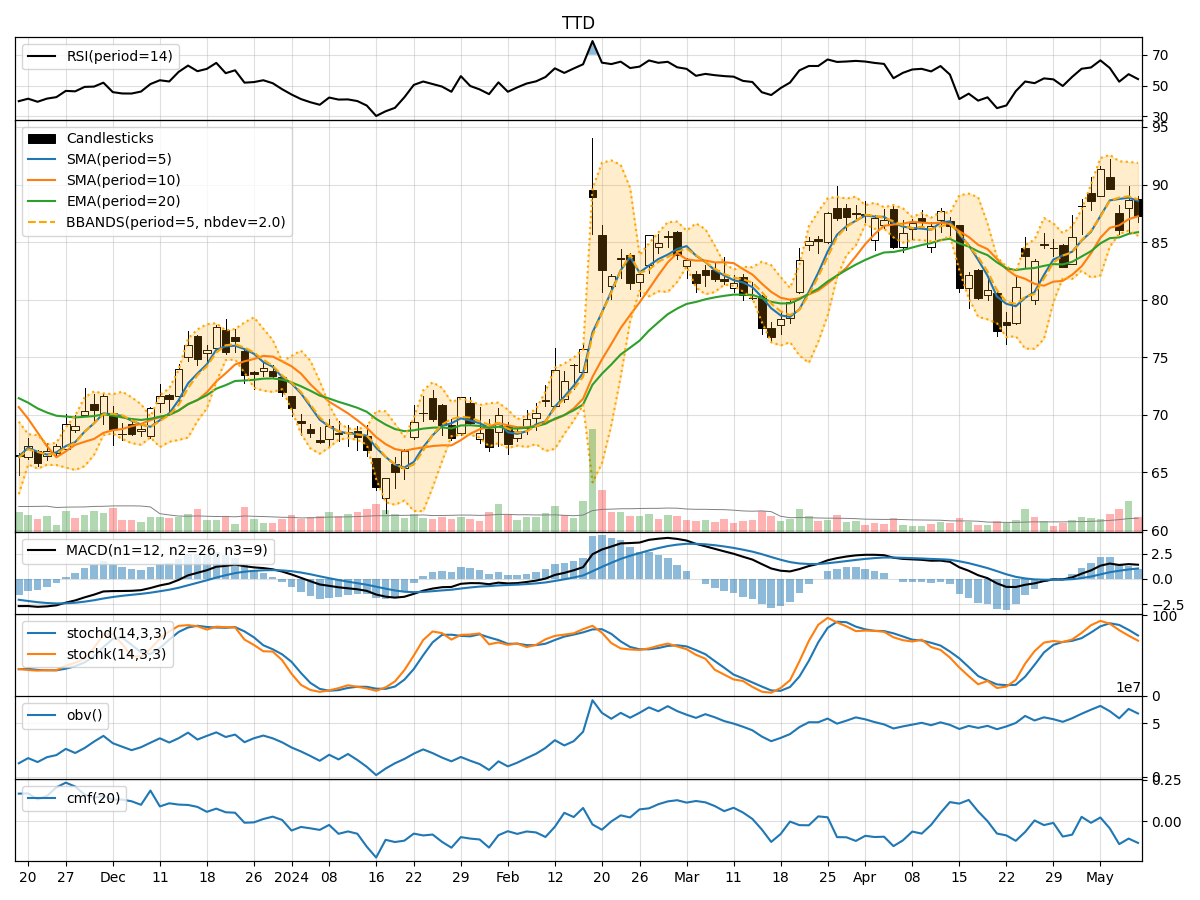
- Moving Averages (MA): The 5-day Moving Average (MA) has been fluctuating around the mid-$80 range, indicating a relatively stable trend.
- MACD: The MACD line has shown slight fluctuations but has generally remained positive, suggesting a bullish momentum.
- EMA: The Exponential Moving Average (EMA) has been on an upward trajectory, indicating a positive trend.
Key Observation: The trend indicators suggest a bullish sentiment in the short term.
Momentum Analysis:
- RSI: The Relative Strength Index (RSI) has been oscillating within the neutral range, indicating a balanced momentum.
- Stochastic Oscillator: Both %K and %D have shown a downward trend, signaling a potential weakening momentum.
- Williams %R: The Williams %R has been hovering in the oversold territory, suggesting a possible reversal.
Key Observation: The momentum indicators reflect a neutral to slightly bearish outlook.
Volatility Analysis:
- Bollinger Bands: The Bollinger Bands have shown narrowing volatility, indicating a potential price breakout.
- Bollinger %B: The %B indicator has been fluctuating around the midline, suggesting a balanced volatility level.
Key Observation: Volatility indicators point towards a potential price breakout in the near future.
Volume Analysis:
- On-Balance Volume (OBV): The OBV has shown mixed signals with fluctuations in volume accumulation.
- Chaikin Money Flow (CMF): The CMF has been negative, indicating a bearish money flow trend.
Key Observation: Volume indicators suggest a mixed sentiment with no clear direction.
Conclusion:
Based on the analysis of trend, momentum, volatility, and volume indicators, the overall outlook for TTD in the next few days is as follows:
- Trend: Upward trend based on moving averages and EMA.
- Momentum: Neutral to slightly bearish momentum based on RSI and Stochastic Oscillator.
- Volatility: Potential price breakout indicated by Bollinger Bands.
- Volume: Mixed sentiment with no clear direction.
Final Verdict:
Considering the mixed signals from momentum and volume indicators, alongside the potential for a price breakout indicated by volatility measures, the next few days for TTD could see increased volatility with a slight bearish bias. Traders should closely monitor key support and resistance levels for potential entry or exit points.