Technical Analysis of TTEK 2024-05-10
Overview:
In analyzing the technical indicators for TTEK over the last 5 days, we will delve into the trend, momentum, volatility, and volume indicators to provide a comprehensive outlook on the possible stock price movement in the coming days. By examining these key aspects, we aim to offer valuable insights and predictions for informed decision-making.
Trend Analysis:
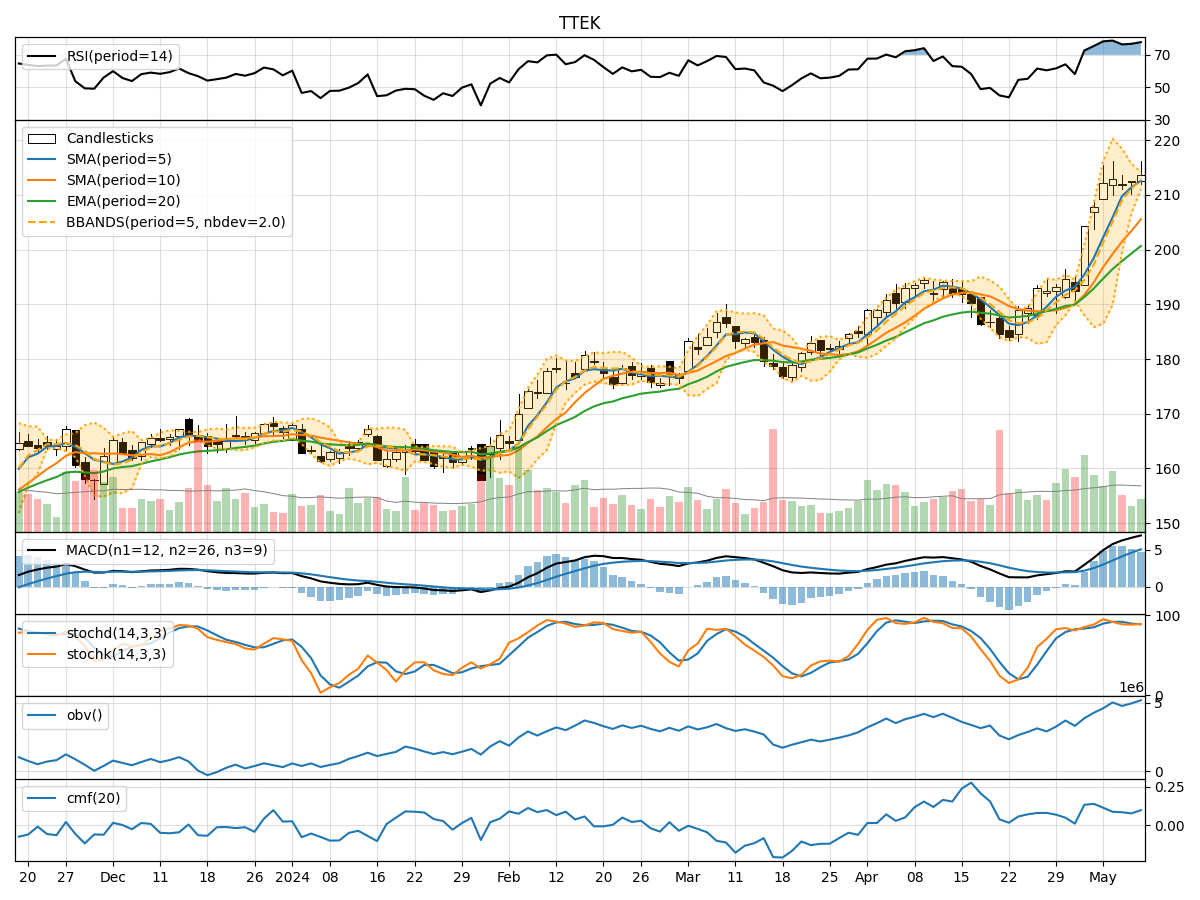
- Moving Averages (MA): The 5-day Moving Average (MA) has been consistently above the Simple Moving Average (SMA) and Exponential Moving Average (EMA), indicating a bullish trend.
- MACD: The MACD line has been above the signal line, with both lines showing an upward trend, suggesting bullish momentum.
- Conclusion: The trend indicators point towards an upward trend in the stock price.
Momentum Analysis:
- RSI: The Relative Strength Index (RSI) has been in the overbought territory, indicating strong buying momentum.
- Stochastic Oscillator: Both %K and %D have been relatively high, suggesting bullish momentum.
- Conclusion: Momentum indicators signal a bullish sentiment in the market.
Volatility Analysis:
- Bollinger Bands (BB): The stock price has been trading within the upper Bollinger Band (BBU), indicating high volatility.
- Conclusion: Volatility indicators suggest a high volatility environment for the stock.
Volume Analysis:
- On-Balance Volume (OBV): The OBV has shown an overall increase over the last 5 days, indicating accumulation by investors.
- Chaikin Money Flow (CMF): The CMF has been positive, reflecting buying pressure in the stock.
- Conclusion: Volume indicators point towards positive accumulation and buying interest.
Conclusion:
Based on the analysis of trend, momentum, volatility, and volume indicators, the overall outlook for TTEK is bullish. The stock is likely to experience further upward movement in the coming days, supported by strong buying momentum, positive trend indicators, and increasing volume accumulation. Traders and investors may consider buying opportunities in TTEK, with a focus on managing risk in the high volatility environment.
Key Takeaways:
- Trend: Upward trend indicated by moving averages and MACD.
- Momentum: Strong buying momentum shown by RSI and Stochastic Oscillator.
- Volatility: High volatility environment based on Bollinger Bands.
- Volume: Positive accumulation and buying pressure reflected in OBV and CMF.
In conclusion, the technical analysis suggests a bullish outlook for TTEK, with potential for further price appreciation in the near term. Traders should monitor key levels and indicators to capitalize on potential opportunities in alignment with the prevailing market dynamics.