Technical Analysis of TVGN 2024-05-10
Overview:
In analyzing the technical indicators for TVGN over the last 5 days, we will delve into the trend, momentum, volatility, and volume indicators to provide a comprehensive assessment of the stock's potential price movement. By examining these key factors, we aim to offer valuable insights and predictions for the next few days.
Trend Analysis:
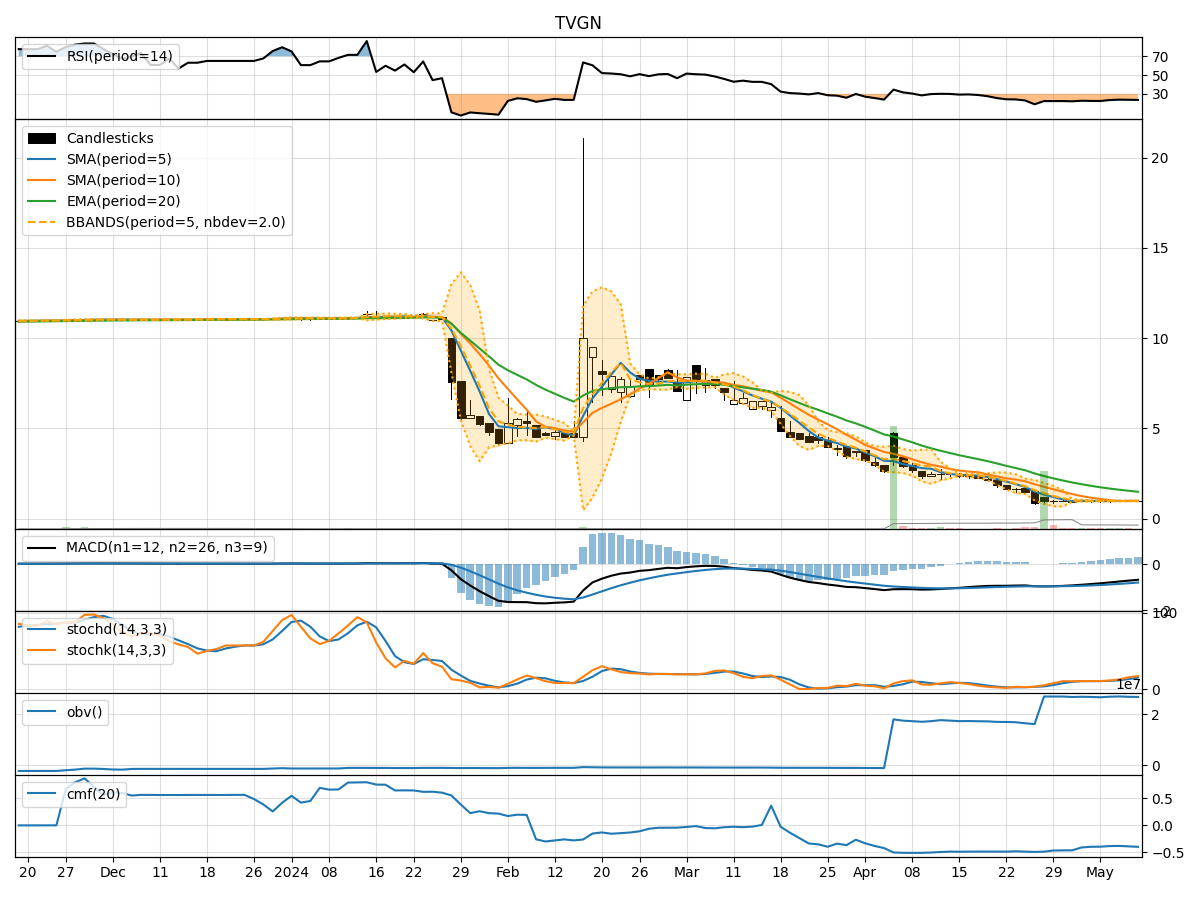
- Moving Averages (MA): The 5-day moving average has been fluctuating around the 0.98-0.99 range, indicating a relatively stable trend in the short term.
- MACD: The MACD line has been consistently below the signal line, suggesting a bearish momentum in the stock's price movement.
- EMA: The exponential moving average has been declining, reflecting a downward trend in the stock's price.
Key Observation: The trend indicators point towards a bearish sentiment in the stock's price movement.
Momentum Analysis:
- RSI: The Relative Strength Index has been hovering around the oversold region, indicating a potential reversal or consolidation phase.
- Stochastic Oscillator: Both %K and %D have been rising, suggesting an increase in buying momentum.
- Williams %R: The Williams %R is in the oversold territory, signaling a potential buying opportunity.
Key Observation: The momentum indicators suggest a potential reversal or consolidation in the stock's price movement.
Volatility Analysis:
- Bollinger Bands: The stock price has been trading within the lower Bollinger Band, indicating a period of low volatility.
- Bollinger %B: The %B indicator is below 1, suggesting the stock is trading below the lower band.
- Average True Range (ATR): The ATR value has decreased, indicating a decrease in volatility.
Key Observation: Volatility indicators point towards a low volatility environment for the stock.
Volume Analysis:
- On-Balance Volume (OBV): The OBV has been fluctuating, indicating a balance between buying and selling pressure.
- Chaikin Money Flow (CMF): The CMF has been negative, suggesting a bearish money flow in the stock.
Key Observation: Volume indicators reflect a neutral sentiment in terms of buying and selling pressure.
Conclusion:
Based on the analysis of the trend, momentum, volatility, and volume indicators, the next few days' possible stock price movement for TVGN is likely to be sideways with a potential for a bullish reversal. The bearish trend indicated by the trend indicators may see a reversal supported by the momentum indicators showing signs of potential buying momentum. However, the low volatility and neutral volume indicators suggest a cautious approach.
In conclusion, the stock is likely to experience a period of consolidation with a potential for a bullish reversal in the near term. Investors should closely monitor key support and resistance levels for confirmation of the anticipated price movement.