Technical Analysis of VFS 2024-05-10
Overview:
In analyzing the technical indicators for VFS stock over the last 5 days, we will delve into the trend, momentum, volatility, and volume indicators to provide a comprehensive outlook on the possible stock price movement in the coming days. By examining these key indicators, we aim to offer valuable insights and predictions to guide investment decisions.
Trend Analysis:
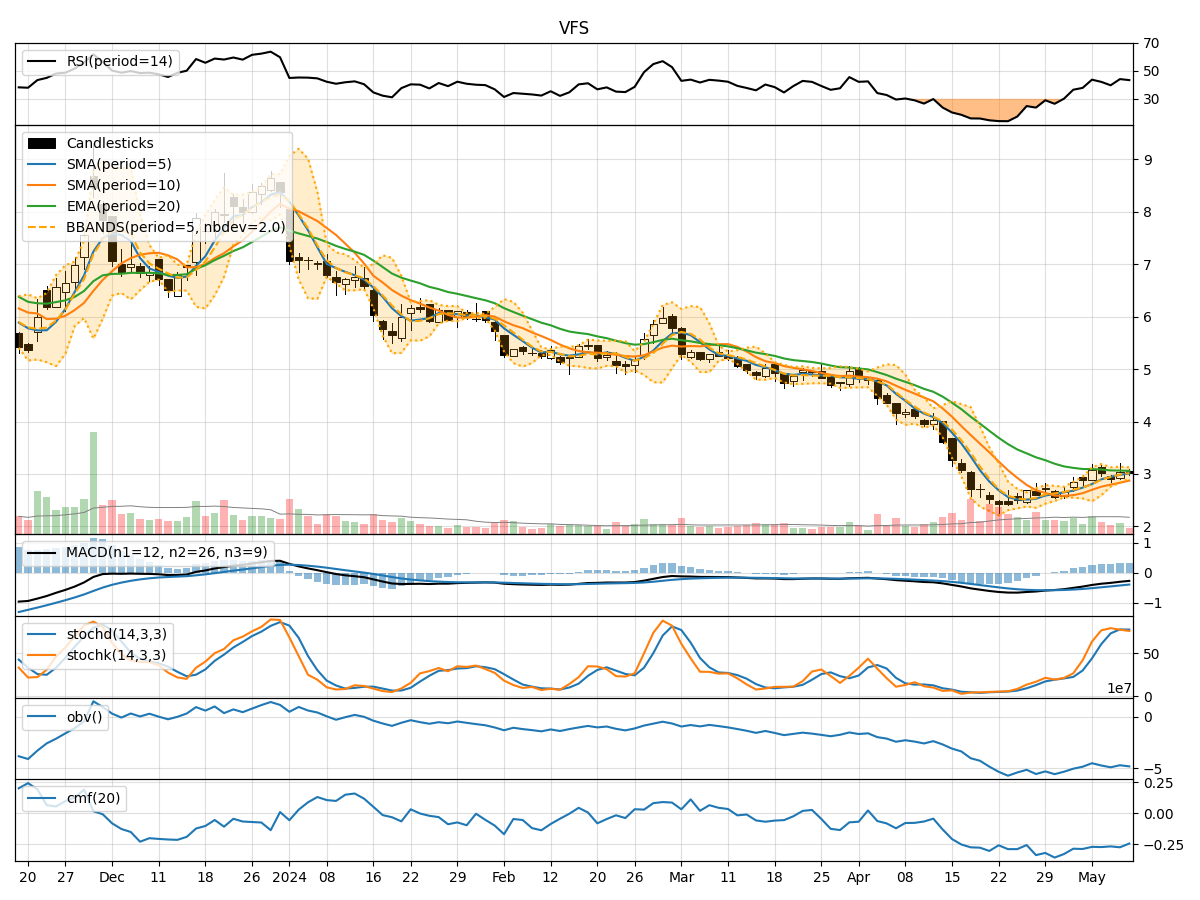
- Moving Averages (MA): The 5-day Moving Average (MA) has been consistently above the Simple Moving Average (SMA) and Exponential Moving Average (EMA) over the past 5 days, indicating a bullish trend.
- MACD: The Moving Average Convergence Divergence (MACD) has shown positive values, with the MACD line consistently above the Signal line, suggesting bullish momentum in the stock price.
Momentum Analysis:
- RSI: The Relative Strength Index (RSI) has been fluctuating around the 40-50 range, indicating a neutral momentum in the stock.
- Stochastic Oscillator: Both %K and %D lines of the Stochastic Oscillator have been hovering around the overbought territory, suggesting a potential reversal in the stock price.
Volatility Analysis:
- Bollinger Bands: The Bollinger Bands have been narrowing, indicating decreasing volatility in the stock price.
- Bollinger %B: The %B indicator has been declining, suggesting that the stock price is currently trading closer to the lower band of the Bollinger Bands.
Volume Analysis:
- On-Balance Volume (OBV): The OBV indicator has been showing a slight decline over the past 5 days, indicating a decrease in buying pressure.
- Chaikin Money Flow (CMF): The CMF has been negative, reflecting a bearish money flow in the stock.
Conclusion:
Based on the analysis of the technical indicators, the stock of VFS is likely to experience sideways movement in the coming days. The bullish trend indicated by the Moving Averages and MACD may be offset by the neutral momentum suggested by the RSI and potential reversal indicated by the Stochastic Oscillator. The decreasing volatility and negative money flow further support the view of a sideways trend.
Key Conclusion: The stock is expected to consolidate in the near term, with limited upside or downside potential. Traders may consider adopting a range-bound strategy until clearer signals emerge from the technical indicators.