Technical Analysis of VINP 2024-05-10
Overview:
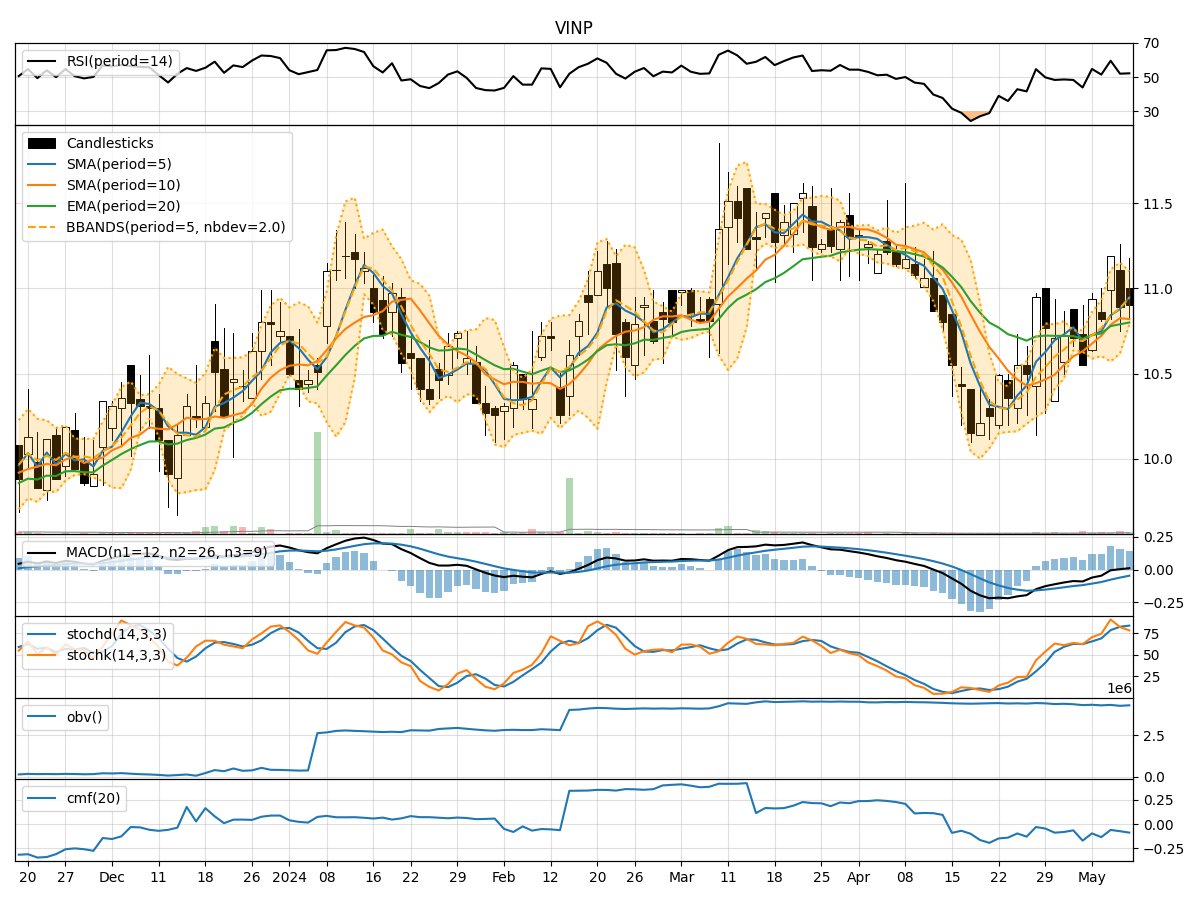
In the last 5 trading days, VINP stock has shown mixed movements with fluctuations in price and volume. The technical indicators across trend, momentum, volatility, and volume provide insights into the stock's potential future price movements. Let's analyze each category of indicators to determine the possible direction of VINP stock in the next few days.
Trend Indicators:
- Moving Averages (MA): The 5-day MA has been trending above the closing prices, indicating a short-term bullish trend.
- MACD: The MACD line has been consistently above the signal line, suggesting a bullish momentum.
- EMA: The EMA has been gradually increasing, reflecting a positive trend in the stock price.
Key Observation: The trend indicators suggest a bullish sentiment in the short term.
Momentum Indicators:
- RSI: The RSI has been fluctuating around the 50 level, indicating a neutral momentum.
- Stochastic Oscillator: Both %K and %D have been in the overbought zone, suggesting a potential reversal.
- Williams %R: The Williams %R is in the oversold territory, indicating a possible buying opportunity.
Key Observation: The momentum indicators show a mixed sentiment with a slight bearish bias.
Volatility Indicators:
- Bollinger Bands: The stock price has been trading within the bands, indicating normal volatility.
- Bollinger %B: The %B is below 1, suggesting the stock is trading below the upper band.
- Bollinger Bandwidth: The bandwidth has been relatively stable, indicating consistent volatility levels.
Key Observation: The volatility indicators suggest a stable price movement with no extreme fluctuations.
Volume Indicators:
- On-Balance Volume (OBV): The OBV has shown a slight decrease, indicating some distribution.
- Chaikin Money Flow (CMF): The CMF has been negative, suggesting selling pressure in the stock.
Key Observation: The volume indicators indicate a slight bearish sentiment with some selling pressure.
Conclusion:
Based on the analysis of technical indicators, the next few days' possible stock price movement for VINP is likely to be sideways to slightly bearish. While the trend indicators signal a bullish sentiment, the momentum and volume indicators point towards a more cautious outlook. The stock may experience some consolidation or minor downward pressure in the near term. Traders should closely monitor key support and resistance levels for potential entry or exit points.
Key Conclusion: The overall outlook for VINP stock is neutral to slightly bearish in the short term.