Technical Analysis of VOD 2024-05-31
Overview:
In analyzing the technical indicators for VOD over the last 5 days, we will delve into the trend, momentum, volatility, and volume indicators to provide a comprehensive outlook on the possible stock price movement in the coming days. By examining these key aspects, we aim to offer valuable insights and predictions for potential investors.
Trend Indicators:
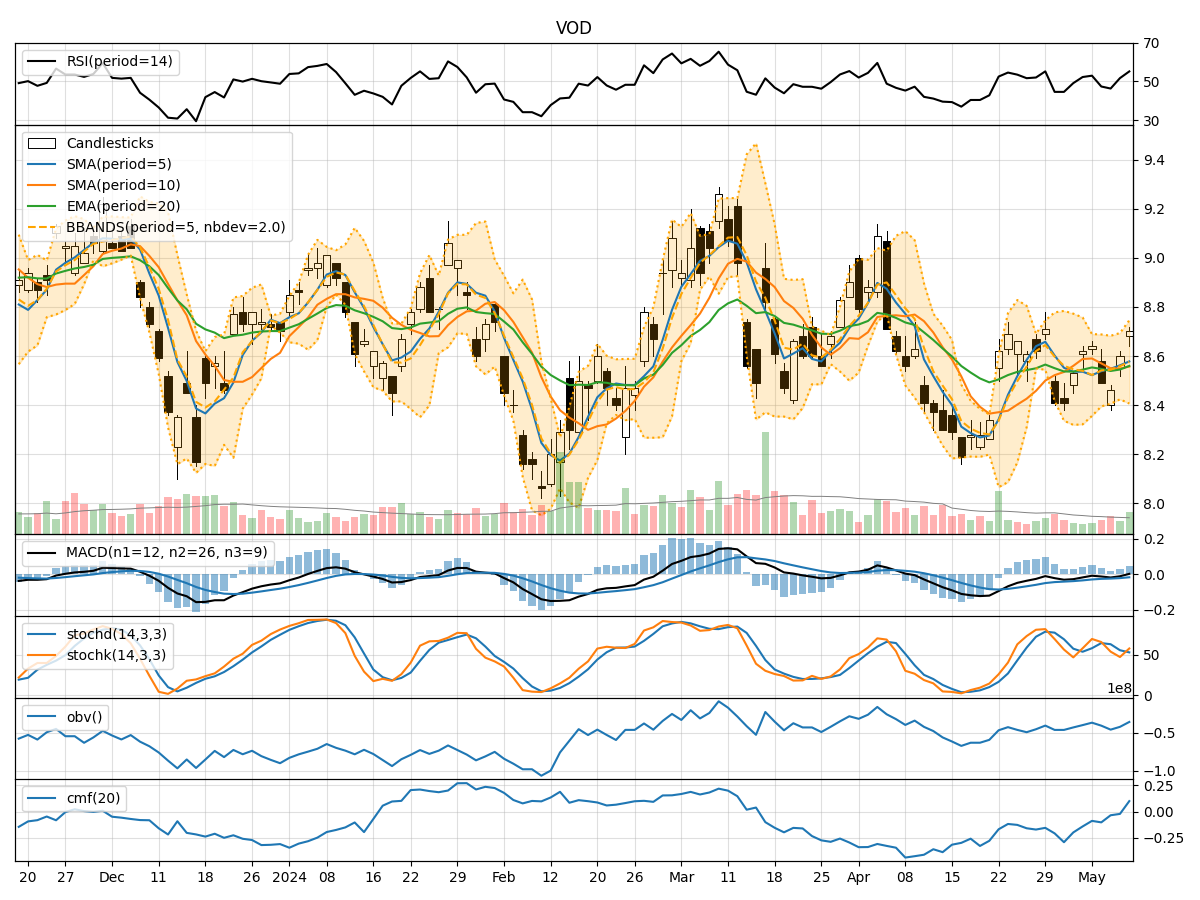
- Moving Averages (MA): The 5-day MA has been fluctuating around the closing prices, indicating short-term price trends. The SMA(10) and EMA(20) show a slight upward trend, suggesting a positive momentum.
- MACD: The MACD line has been consistently positive, with the MACD histogram showing a slight increase, indicating a bullish momentum.
Momentum Indicators:
- RSI: The RSI values have been in the neutral to slightly overbought territory, suggesting a balanced momentum.
- Stochastic Oscillator: Both %K and %D values are in the neutral zone, indicating a lack of strong directional momentum.
Volatility Indicators:
- Bollinger Bands (BB): The bands have been relatively narrow, indicating low volatility in the stock price.
Volume Indicators:
- On-Balance Volume (OBV): The OBV has shown an increasing trend, suggesting accumulation by investors.
- Chaikin Money Flow (CMF): The CMF has been positive, indicating buying pressure in the stock.
Key Observations and Opinions:
- Trend: The trend indicators suggest a slightly bullish sentiment in the short term.
- Momentum: Momentum indicators show a lack of strong directional momentum, indicating a potential consolidation phase.
- Volatility: Low volatility as indicated by the Bollinger Bands suggests a stable price movement.
- Volume: Increasing OBV and positive CMF indicate buying interest in the stock.
Conclusion:
Based on the analysis of the technical indicators, the stock of VOD is likely to experience sideways movement in the next few days. The lack of strong momentum coupled with low volatility suggests a period of consolidation. Investors may expect the stock price to trade within a narrow range without significant upward or downward movements. It is advisable to closely monitor the trend and volume indicators for any potential shifts in market sentiment.