Technical Analysis of VRAR 2024-05-10
Overview:
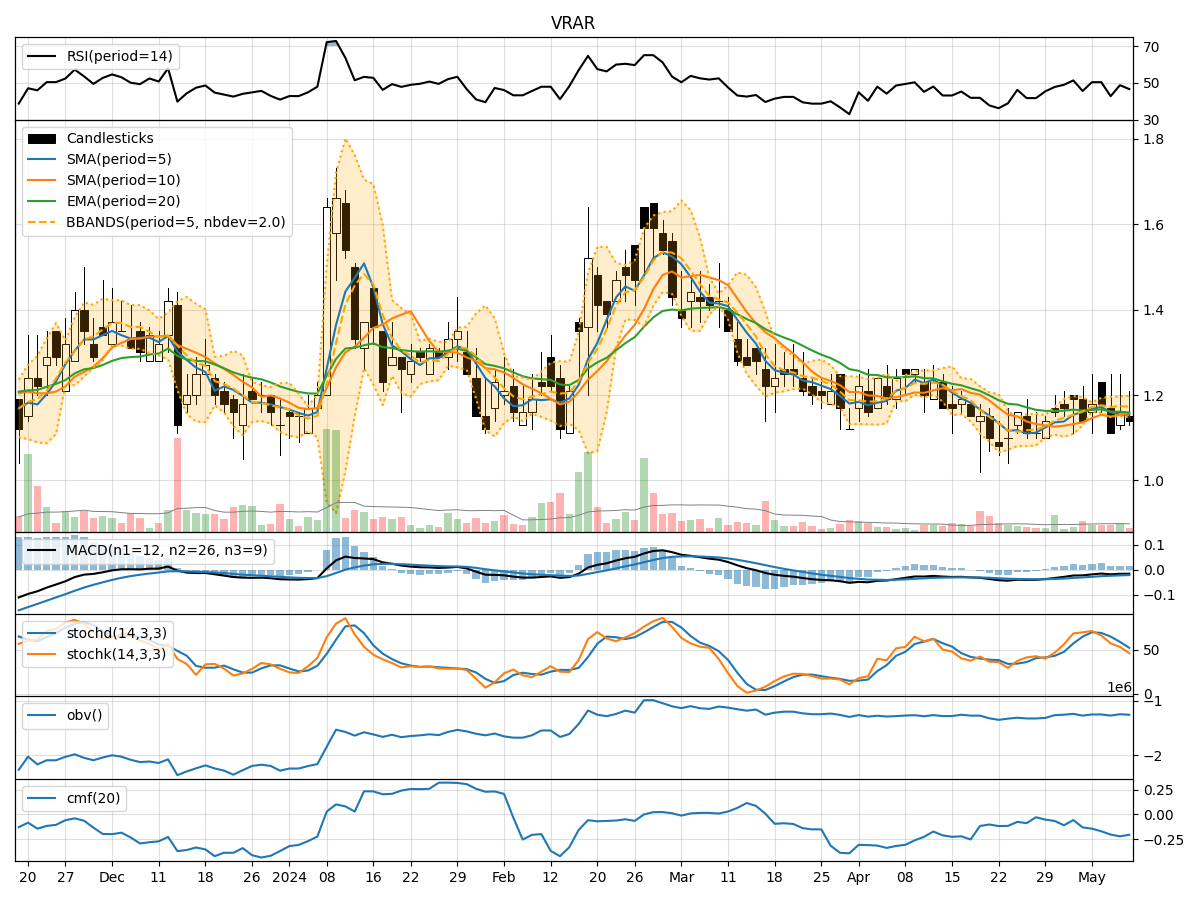
In analyzing the technical indicators for VRAR stock over the last 5 days, we will delve into the trend, momentum, volatility, and volume indicators to provide a comprehensive outlook on the possible stock price movement in the coming days.
Trend Analysis:
- Moving Averages (MA): The 5-day Moving Average (MA) has been fluctuating around the current price, indicating a lack of clear trend direction.
- MACD: The Moving Average Convergence Divergence (MACD) has been consistently negative, suggesting a bearish momentum in the short term.
- EMA: The Exponential Moving Average (EMA) has been relatively stable but slightly below the current price, indicating a potential resistance level.
Momentum Analysis:
- RSI: The Relative Strength Index (RSI) has been hovering around the neutral zone, indicating a lack of strong momentum in either direction.
- Stochastic Oscillator: Both %K and %D of the Stochastic Oscillator have been declining, signaling a potential bearish momentum.
- Williams %R: The Williams %R is in the oversold territory, suggesting a possible reversal or consolidation phase.
Volatility Analysis:
- Bollinger Bands: The Bollinger Bands have been narrowing, indicating decreasing volatility and a potential breakout or breakdown in the near future.
- Bollinger %B: The %B indicator is relatively low, suggesting a possible oversold condition or a consolidation phase.
Volume Analysis:
- On-Balance Volume (OBV): The OBV has been fluctuating, indicating mixed buying and selling pressure.
- Chaikin Money Flow (CMF): The CMF has been negative, indicating a potential outflow of money from the stock.
Key Observations and Opinions:
- Trend: The trend indicators suggest a lack of clear direction, with a slightly bearish bias based on the MACD.
- Momentum: Momentum indicators point towards a weakening bullish momentum and a potential shift towards bearish sentiment.
- Volatility: Volatility is decreasing, indicating a possible period of consolidation before a significant price movement.
- Volume: Volume indicators show mixed signals, reflecting uncertainty in market participation.
Conclusion:
Based on the analysis of the technical indicators, the next few days for VRAR stock are likely to see sideways consolidation with a slight bearish bias. Traders should exercise caution and wait for a clearer trend to emerge before making significant trading decisions. It is advisable to closely monitor key support and resistance levels for potential breakout or breakdown scenarios.